
Drought in the Colorado River Basin
Insights using open data

Since 2000, the Colorado River Basin (Basin) has been experiencing a historic, extended drought that has impacted regional water supply and other resources, such as hydropower, recreation, and ecologic services. During this time, the Basin has experienced its lowest 16-year period of inflow in over 100 years of record keeping, and reservoir storage in the Colorado River system has declined from nearly full to about half of capacity.
This application was developed by the U.S. Geological Survey and the Bureau of Reclamation in support of the Department of the Interior’s Open Water Data Initiative (OWDI). This visualization is part of a multi-agency effort to showcase the usefulness of open data (i.e., data provided in a discoverable, sharable, and machine-readable format) by exploring the current 16-year drought and its effects on the Colorado River Basin.
Concern is growing about the impacts of the ongoing drought and declining reservoir levels, such as decreasing water supply and the possibility of a first-ever shortage condition of drinking water for the Lower Basin; decreasing hydropower capacities at Lake Powell and Lake Mead; the potential for loss of hydroelectric generation at Lake Powell; reduced recreational opportunities; and changes to in-stream flows that support ecosystems.
In response to drought conditions, Federal agencies and stakeholders throughout the Basin have been working together to find creative ways to reduce the effects of the drought on the people and resources that rely on water from the Colorado River.
Scroll down to learn more about the importance of the Colorado River, the impacts of the current drought, and the ways in which the drought is being managed in the Basin.
Read More >>


Water from the Colorado River is essential for life in parts of the southwestern United States and northwestern Mexico. According to the Colorado River Basin Water Supply and Demand Study (2012), the Colorado River and its tributaries:
- Supply more than 1 in 10 Americans with some, if not all, of their water for municipal use, including drinking water.
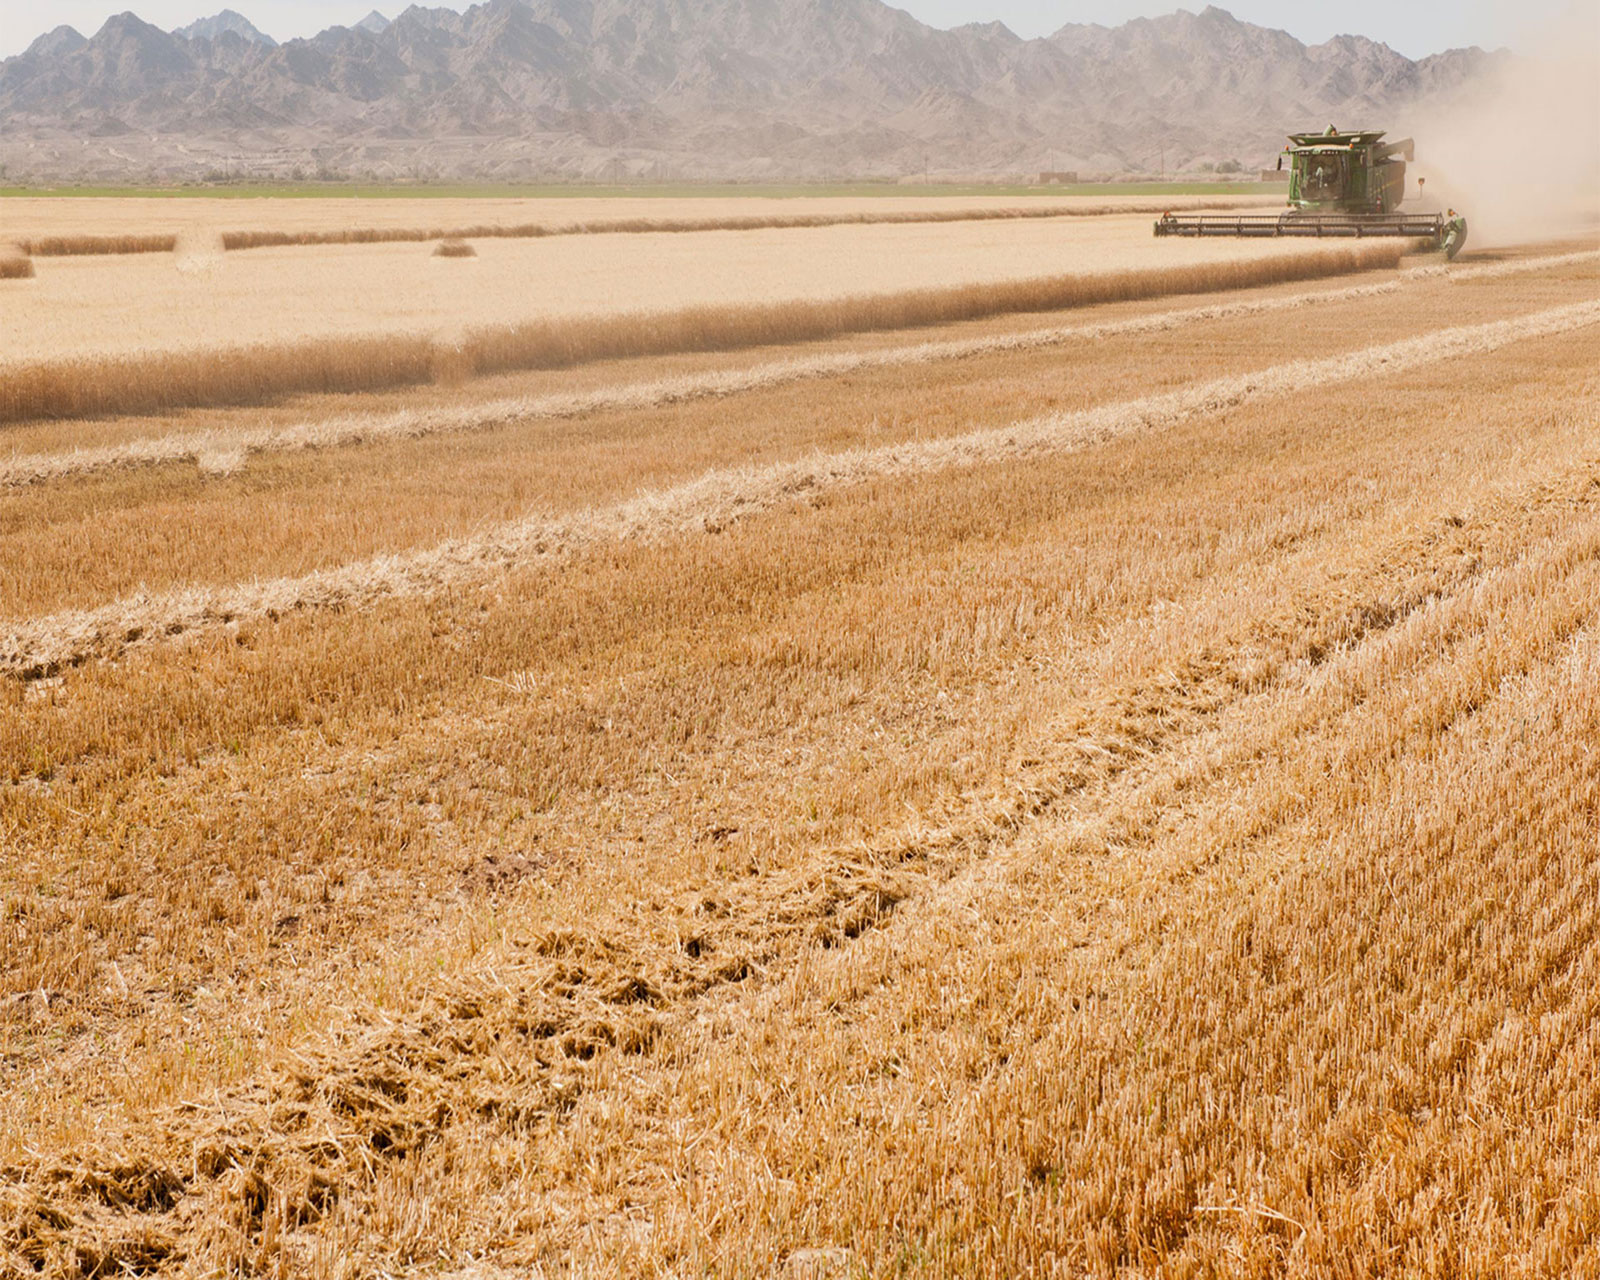
- Provide irrigation water to more than 5.5 million acres (approximately 8,590 square miles) of land.
- Are essential as a physical, economic and cultural resource to at least 22 federally recognized Tribes.
- Support 4,200 megawatts of electrical generating capacity, providing power to hundreds of local areas and millions of people.
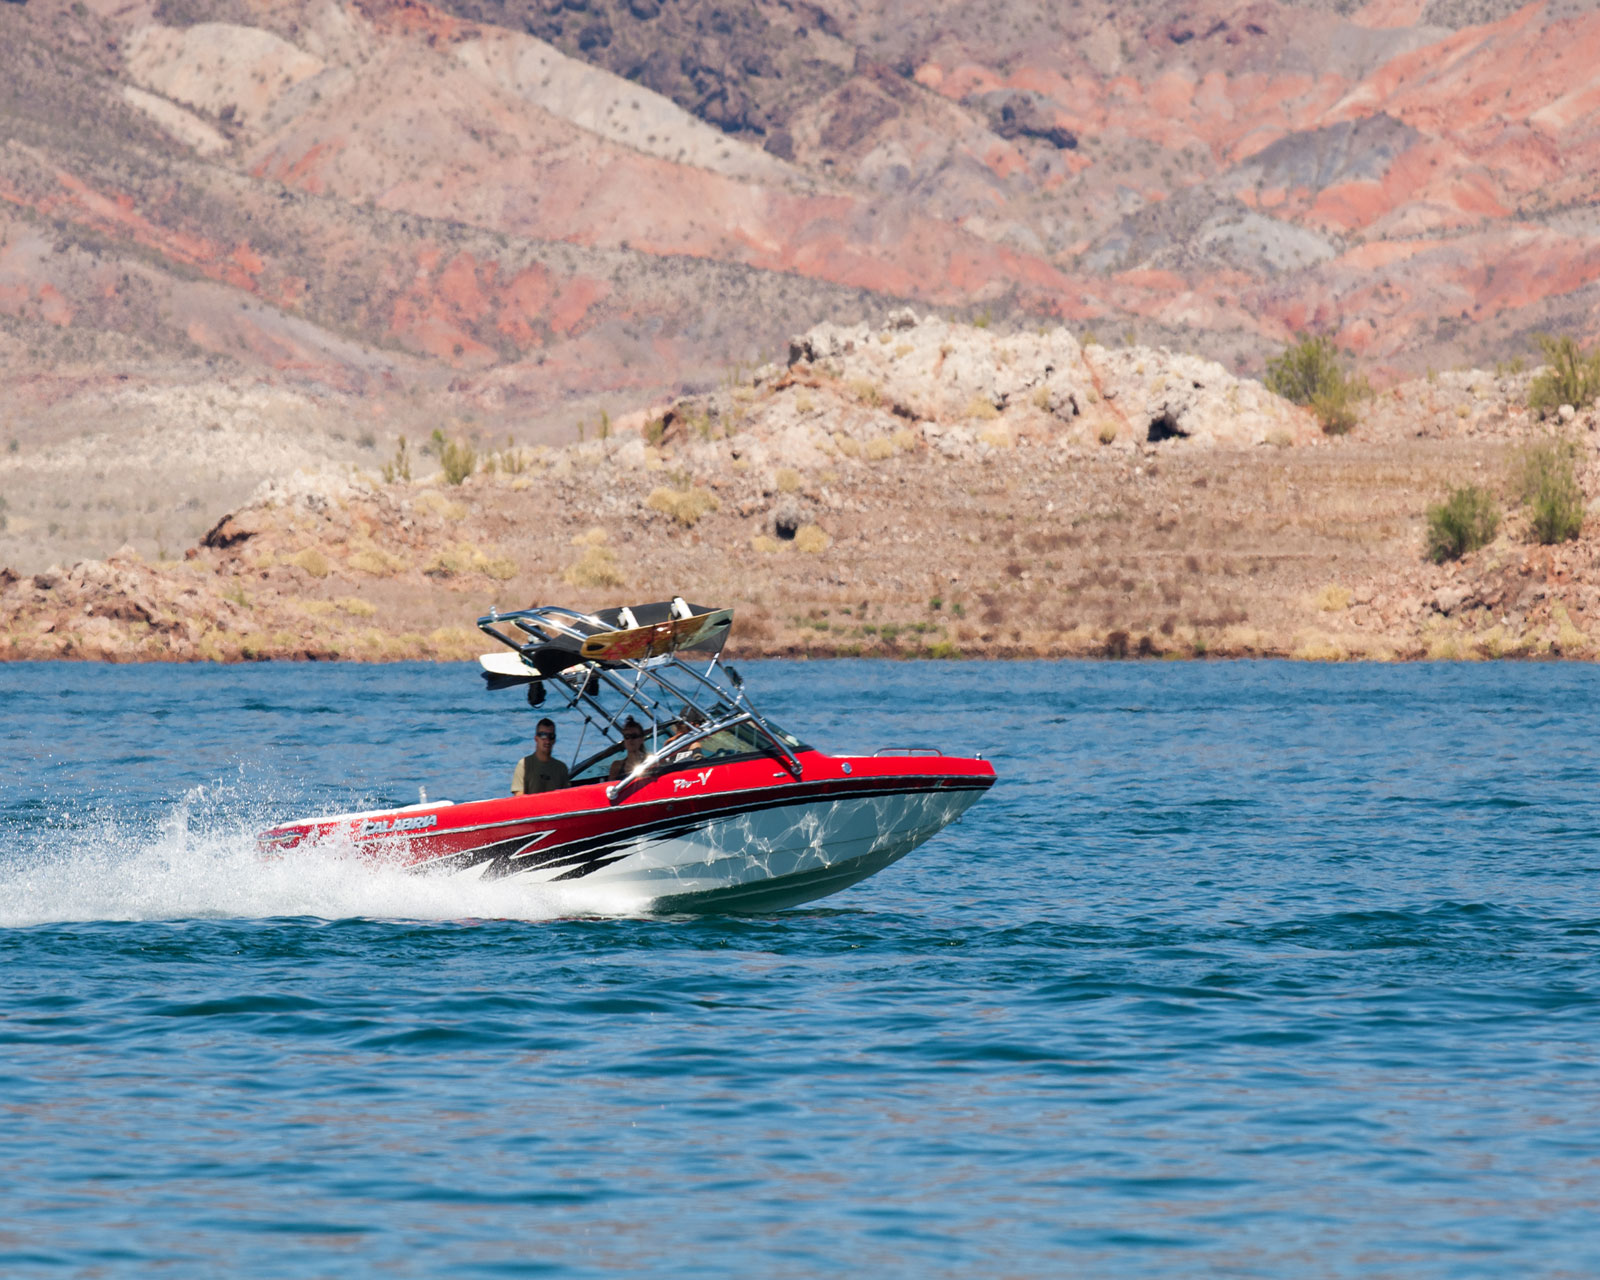
- Are directly linked to nine National Park Service units and seven National Wildlife Refuges, supporting over $1 billion in tourism revenue associated with outdoor recreation and wildlife.
- Provide habitat for a wide range of species, including threatened and endangered species, as well as other species of wildlife and vegetation.
Bureau of Reclamation, 2012. Colorado River Basin Water Supply and Demand Study.


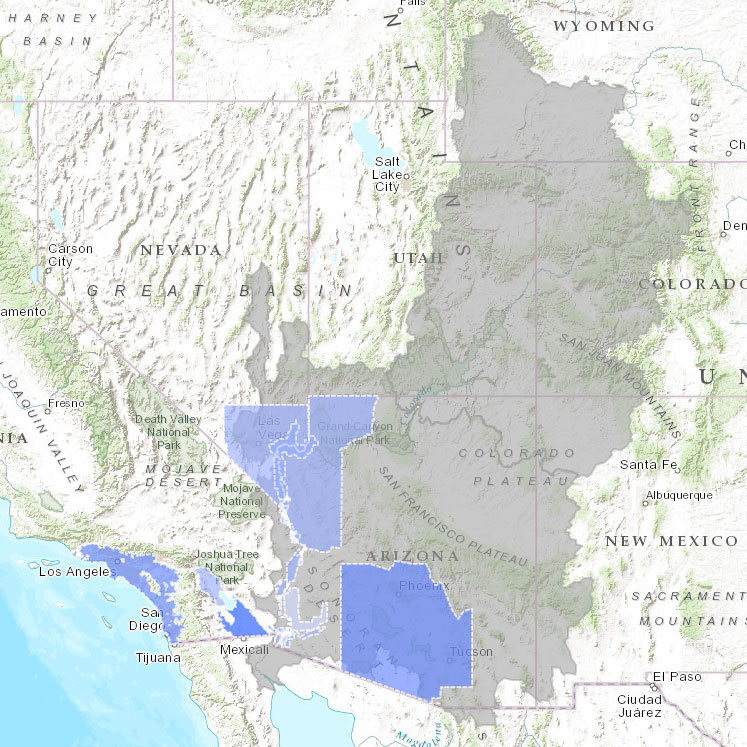
Approximately 1,400 miles long and flowing through seven U.S. States and into Mexico, the Colorado River drains roughly one-twelfth of the land area of the contiguous United States. The Colorado River Basin is divided into the Upper and Lower Basins at the Lee Ferry Colorado River Compact Point (Compact Point) located in northern Arizona. The Upper Basin spans portions of Wyoming, Colorado, New Mexico, Utah, and northern Arizona. The Lower Basin covers parts of Nevada, Arizona, California, southwestern Utah, and western New Mexico. The Colorado River also supplies water to parts of the states of Baja California and Sonora in northwestern Mexico.
The Upper Colorado River Basin supplies approximately 90 percent of the water for the entire Basin. This water originates as precipitation and snowmelt in the Rocky and Wasatch Mountains. About 50 percent of streamflow comes from baseflow, which is surface water that percolates into groundwater aquifers and then resurfaces as streamflow (Rumsey et al., 2015). The Lower Basin is arid, with little tributary runoff reaching the mainstream of the Colorado River except during occasional rain events.
The Lower Basin depends upon managed use of the Colorado River system to make its surrounding land habitable and productive. Colorado River water is also delivered to areas that lie outside the Basin’s hydrologic boundary, including parts of southern California, the east side of the Front Range in Colorado, and the west side of the Wasatch Range in Utah. In addition, federally recognized Tribes hold a substantial amount of quantified and unquantified Federal reserved water rights to the Colorado River and its tributaries (approximately 2.9 million acre-feet of annual diversion rights).
Resources and facilities, such as dams and power plants, in the Colorado River Basin are managed to accomplish their project goals in a manner fully consistent with applicable provisions of Federal law including the Law of the River and other project-specific operational guidelines. The Law of the River includes operating criteria, regulations, administrative decisions, Federal statutes, interstate compacts, court decisions and decrees, an international treaty, and contracts with the Secretary of the U.S. Department of the Interior (Secretary), and defines the responsibilities of the Secretary’s water master role in the Lower Basin.
Read More >>
Rumsey, C.A., et al. 2015. "Regional scale estimates of baseflow and factors influencing baseflow in the Upper Colorado River Basin." Journal of Hydrology: Regional Studies 4: 91-107.

The dams and canals in the Colorado River system provide storage for regional water supply, facilitate water deliveries, provide flood control benefits, improve navigation, and generate hydroelectric power. These facilities are operated in coordination with adjacent or nearby water delivery systems that also provide a variety of other economic, cultural, and ecologic benefits.
In the Lower Basin, Hoover Dam was constructed to control floods, improve navigation and regulate the river's flow, provide water storage and delivery, and generate electric energy. Davis Dam and Parker Dam were constructed to regulate water released from Hoover Dam. Near the southern end of the system, Imperial Dam serves as the last diversion dam on the Colorado River for the United States, with Morelos Dam diverting Colorado River water into Mexico.
Water is released from these facilities to satisfy delivery commitments to users in Nevada, California, Arizona and Mexico, and to generate hydropower with these water releases. Pumping facilities located on Lake Havasu behind Parker Dam divert water to the Metropolitan Water District of Southern California and Central Arizona Project. From Imperial Dam's headworks, water is diverted into the All-American Canal on the California side of the dam and into the Gila Gravity Main Canal on the Arizona side of the dam. These diversions provide water to the Gila Project, the Yuma Project, the Imperial Irrigation District, the Coachella Valley Water District, and the City of Yuma, and to the Northerly International Boundary (NIB) for diversion at Morelos Dam into Mexico.
Read More >>
Hover over sections of the diagram below to get additional information
The diagram above depicts the major dams, reservoirs, and control structures of the Lower Colorado River.
Click here for a PDF version of the Operational Diagram.

Due to year-to-year differences in precipitation and snowmelt, the natural water supply of the Basin is highly variable. Long-term drought like the Basin has experienced since 2000 reflects natural climate variability coupled with the likely impacts from changing climate. Since most of the Basin's water supply comes from the Upper Basin, drought conditions in the Upper Basin impact water supply and resources in both the Upper and Lower Basins of the Colorado River.
The U.S. Geological Survey (USGS) stream gage at Lees Ferry, Arizona, is the lowermost mainstream gage in the Upper Basin, located about 12 miles downstream of Glen Canyon Dam and about 1 mile upstream of the Compact Point between the Upper and Lower Basins. Natural flow at this stream gage location is used as a proxy for the hydrologic conditions in the Upper Basin and the overall hydrologic health of the Basin. Natural flow is defined as the streamflow that would have otherwise occurred without the effects of human activities such as reservoir regulation and river diversions.
Hover over sections of the graph below to take a closer look
In the graphic above, the 10-year average natural flow at Lees Ferry shows periods of below and above average annual flow (approximately 14.8 million acre-feet [maf]). The most recent drought for the 2000-2015 period (indicated by the brown shaded area) was the driest 16-year period in the past 100 years and one of the driest 16-year periods in the past 1,200 years. The graphic also depicts how the early part of the 1900s, which corresponds to the period of reference used to set the apportionments for the Upper and Lower Basins in the 1922 Colorado River Compact, was an unusually wet period (indicated by the green shaded area). At the time the 1922 Colorado River Compact was signed, the average annual inflow at Lees Ferry during the pre-Compact period (1906-1921) was approximately 18.0 maf.
USGS observations of the Colorado River at Lees Ferry (USGS site 09380000) have been recorded since 1895. For more information and data on this site, visit the U.S. Geological Survey National Water Information System Lees Ferry stream gage website. Real-time gage height, discharge, water temperature, sediment, and water-quality properties can be accessed from the U.S. Geological Survey Grand Canyon Monitoring and Research Center website.
The Lees Ferry gage is distinct from the Lee Ferry Compact Point: Lees Ferry refers to the USGS-operated stream gage located near the town of Lees Ferry, Arizona; whereas Lee Ferry refers to the Colorado River Compact Point, as referenced in the 1922 Colorado River Compact. The Lee Ferry Compact Point is located 1 mile downstream of the Lees Ferry gage.
Historical observations are extended by a tree-ring reconstruction of streamflow going back approximately 1,200 years, as estimated by Meko et al. (2007a). Because trees grow less during dry years and more during wet years, tree-ring cores can be used to estimate historical streamflow conditions going back many centuries. Tree-ring core samples were collected from locations throughout the Upper Basin to estimate historical natural flow. These estimates were validated using the observed natural flow record developed by the Bureau of Reclamation.

Bureau of Reclamation. 1922. Minutes of the 19th meeting of the Colorado River Commission.
Bureau of Reclamation, 2015. Natural Flow and Salt Data.
Bureau of Reclamation, 2012. Colorado River Basin Water Supply and Demand Study.
Meko, D.M., C.A. Woodhouse, C.H. Baisan, T. Knight, J.J. Lukas, M.K. Hughes, and M.W. Salzer, 2007. Medieval drought in the upper Colorado River Basin. Geophysical Research Letters, Vol. 34, L10705.
Since 2000, the Colorado River Basin has experienced the driest 16-year period in over 100 years of historical natural flows (Bureau of Reclamation, 2015). This period also ranks as the fifth driest 16-year period in the last 1,200 years (Meko et al., 2007a and 2007b).
While the current drought is severe and historic, the most extreme drought in the Colorado River Basin occurred in the mid-1100s (Meko et al. 2007a). The 1100s drought was characterized by a 25-year period of flows that were 15% lower than the long-term average of 14.8 maf and no higher-flow years (greater than 125% of average) for six decades. By comparison, the current drought is characterized by flows that are 16% lower than the long-term average with one year of higher flows (135% percent of average in 2011).
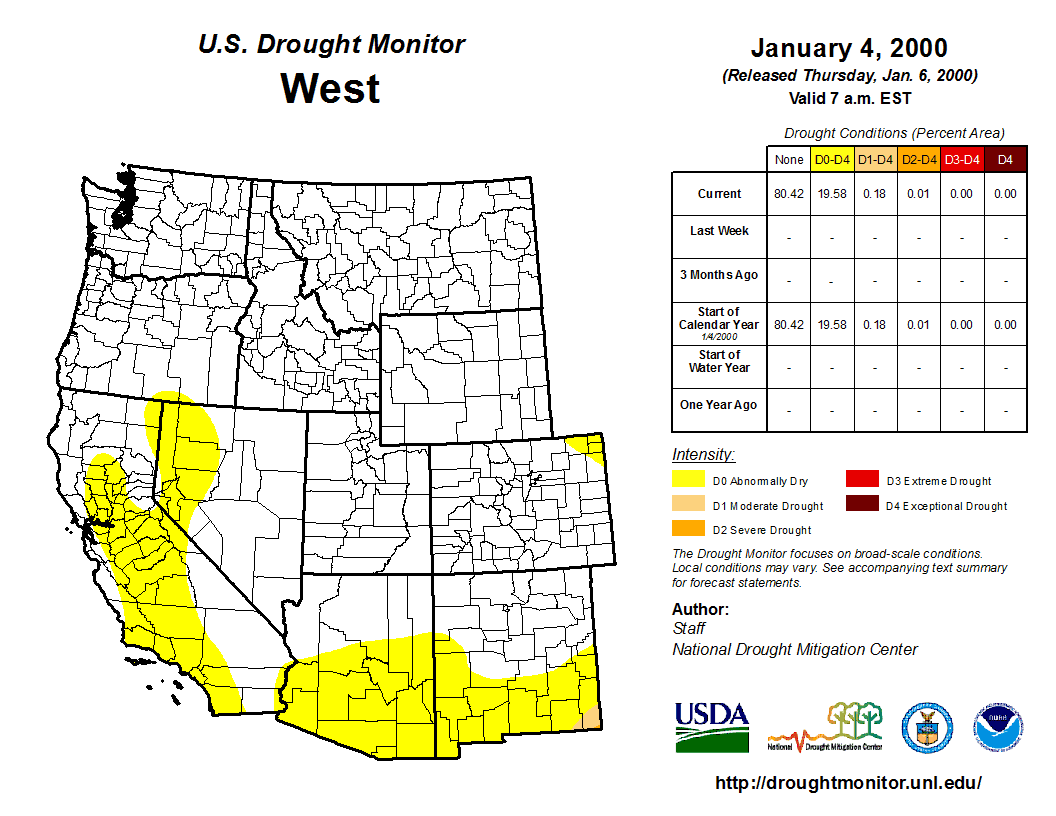
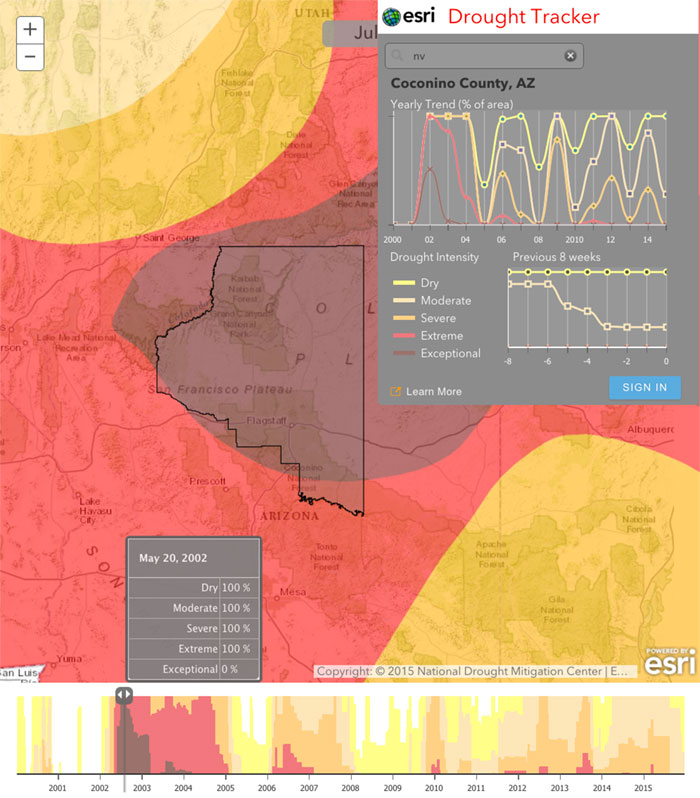
The U.S. Drought Monitor shows the extent and intensity of drought conditions in the Western U.S. from 2000 to 2015. The Esri Drought Tracker provides a means to view drought conditions in the U.S. over time, using data from the U.S. Drought Monitor.
Bureau of Reclamation, 2015. Colorado River Basin Natural Flow and Salt Data website.
Meko, D.M., et al. 2007a. Upper Colorado River Flow Reconstruction. IGBP PAGES/World Data Center for Paleoclimatology. Data Contribution Series # 2007-052. NOAA/NCDC Paleoclimatology Program, Boulder CO, USA.
Meko, D.M., C.A. Woodhouse, C.H. Baisan, T. Knight, J.J. Lukas, M.K. Hughes, and M.W. Salzer. 2007b. Medieval drought in the upper Colorado River Basin. Geophysical Research Letters, Vol. 34, L10705.
The basin-wide storage capacity of the Colorado River totals about 60 million acre-feet (maf), approximately four times the average annual inflow in the Upper Basin (14.8 maf). The Basin’s two largest reservoirs, Lake Powell and Lake Mead hold about 50 maf combined, which is approximately 83 percent of the total system storage capacity. This large storage capacity creates a buffer against year-to-year hydrologic variability and longer-term drought periods by allowing excess water to be stored during wet years and used during dry years.
It is this large amount of basin-wide storage capacity that has allowed the Bureau of Reclamation to continue to meet water delivery requirements during the current drought period. It should be noted, however, that headwater reaches in the Upper Basin can experience localized shortages due to insufficient in-stream flows during dry years.
The volume of water that can be stored in the Colorado River system reservoirs (60 million acre-feet) is enough to cover the State of Utah in about 1 foot of water. Dimensions shown above are not to scale.
Since the early 1900s, water demand in the Colorado River Basin has increased while water supply has, on average, decreased. For the 16-year period preceding the signing of the 1922 Colorado River Compact, when the beneficial consumptive use of 7.5 million acre-feet (maf) per year was apportioned to both the Upper and Lower Basins, the average annual natural flow in the Upper Basin was about 18.0 maf (1906-1921). When the 1944 U.S.-Mexico Water Treaty was executed, the average annual natural flow in the Upper Basin was about 16.3 maf (1906-1944). The current average annual natural flow in the Upper Basin is about 14.8 maf (1906-2015).
As the average annual natural flow has decreased, the difference between water supply and water demand has narrowed and the Colorado River system has been operating on increasingly close margins. As a result of this decrease in natural flows and an increase in water use basin-wide, it now appears that the Colorado River system is over-allocated (Bureau of Reclamation, 2012).
Climate projections indicate more extreme conditions are possible, with longer, more severe wet and dry periods. Cooperation and collaboration are key to finding sustainable solutions and addressing current and future water resources management challenges.
Read More >>
Hover over sections of the graph below to take a closer look
Trends in water supply and water use in the Colorado River Basin are shown above. When water use (red line) exceeds water supply (blue line) in a given year, the amount of water stored is reduced. During the past 20 years, average water supply and average water use have been about equal. Under these conditions, reservoirs are replenished more slowly. Water-supply and water-use data shown in the graphic above are estimated by the Bureau of Reclamation using water accounting information, U.S. Geological Survey stream gage data, and other sources.
In this graphic, water use is shown as “consumptive use” (surface-water diversions and groundwater pumping minus measured and unmeasured return flows) as estimated by the Bureau of Reclamation in its annual water accounting reports. Other estimates of water use that account for withdrawals of surface and groundwater and incorporate water that is used and returned to the stream, are made by the USGS.
Bureau of Reclamation. 2012. Colorado River Basin Water Supply and Demand Study.
Access current reservoir conditions in the Upper Basin and Lower Basin.
As the reservoir levels of Lake Mead and Lake Powell decline, other resources, such as hydropower, recreation, and water quality, are also affected.
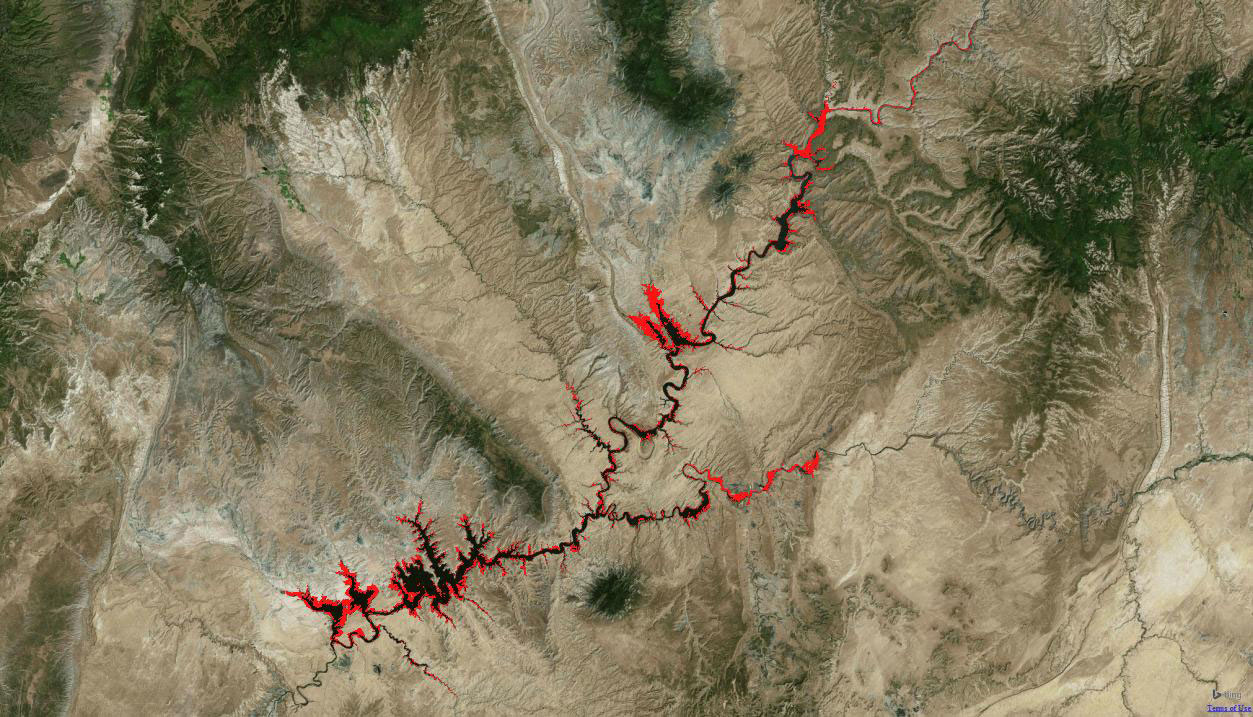

In the photo slider above, the change in the surface area of Lake Powell can be seen from the pre-drought conditions in 1999 to the current drought conditions as of 2014. The red area that emerges represents the loss in the reservoir’s surface area as lake elevations have declined. These maps are based on U.S. Geological Survey Landsat satellite surface reflectance-corrected images acquired in the month of June in 1999 and 2014. Landsat images acquired within 16 days of each other have been merged together to generate cloud-free composite satellite images suitable for measurement and change comparison.
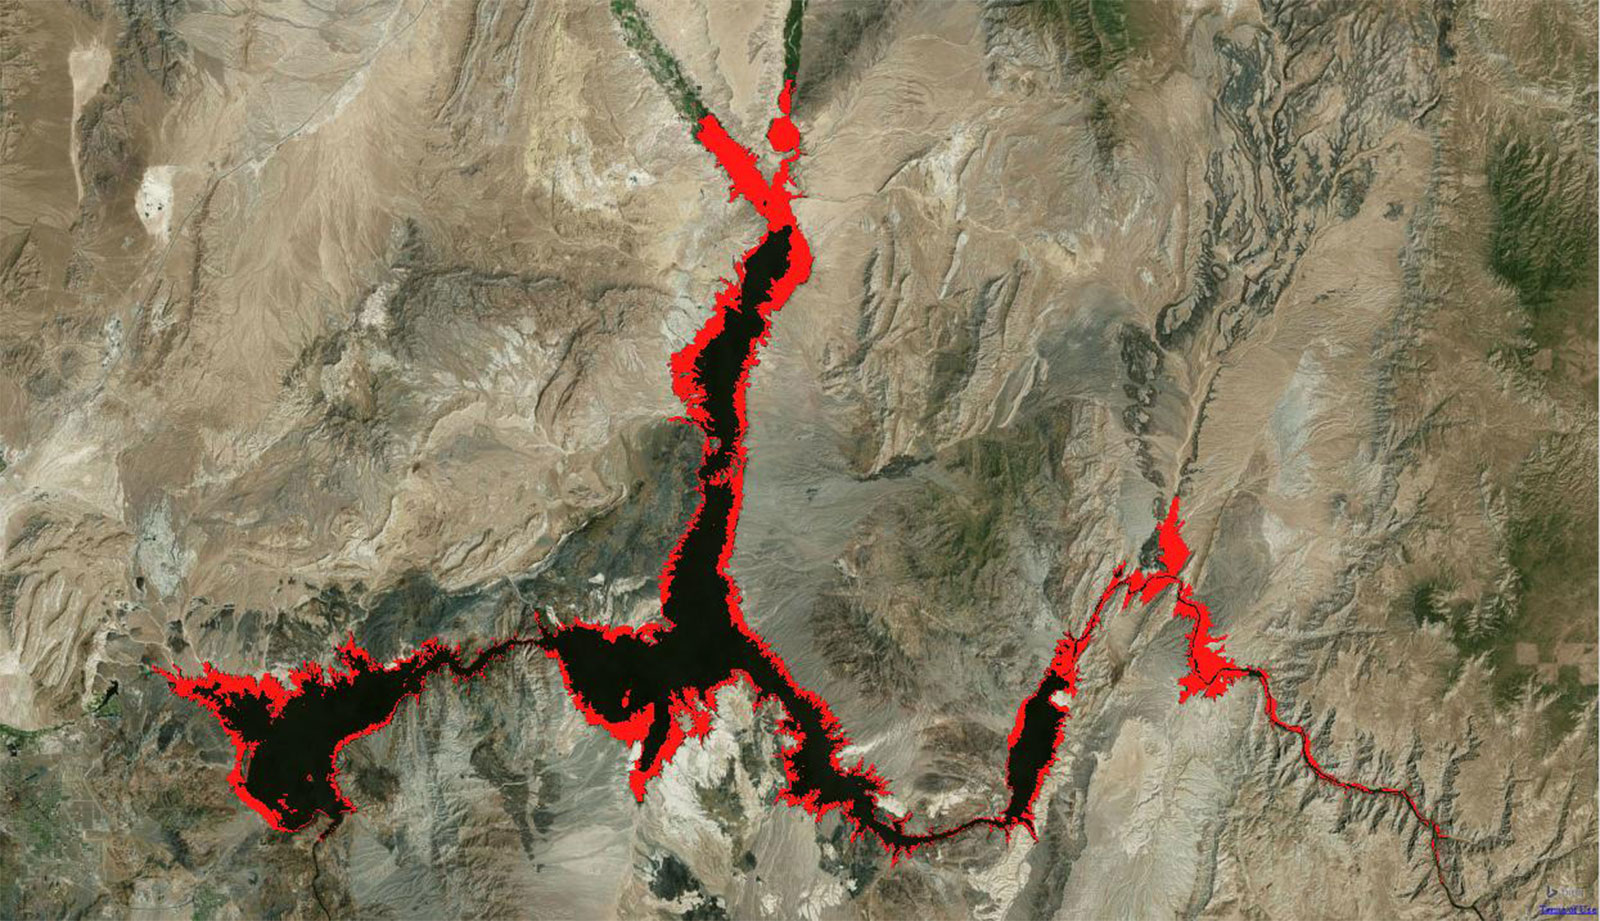

In the photo slider above, the change in the surface area of Lake Mead can be seen from the pre-drought conditions in 1999 to the current drought conditions as of 2014. The red area that emerges represents the loss in the reservoir’s surface area as lake elevations have declined. These maps were prepared using the U.S. Geological Survey Landsat satellite data as described in the Lake Powell caption above.


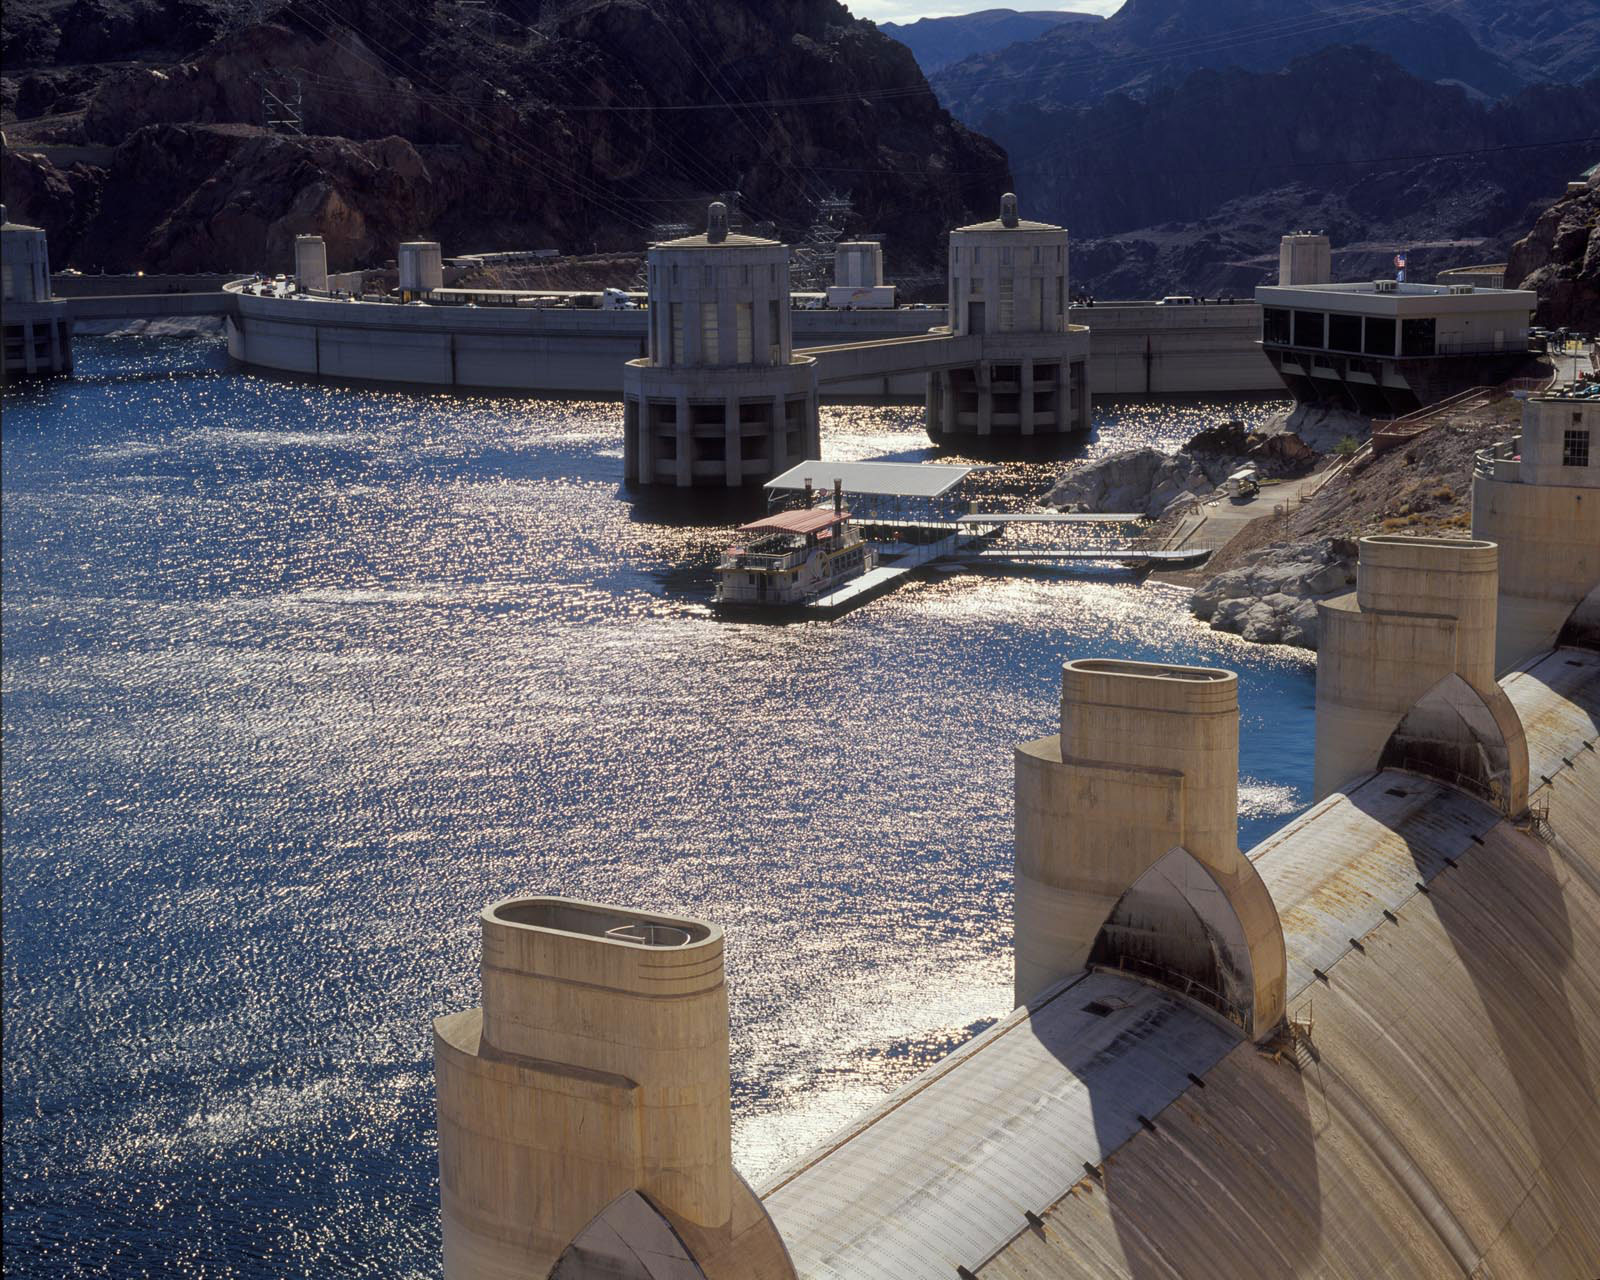

Between 2001 and 2015, Lake Mead’s elevation dropped from 1,196 to 1,075 feet, a decline of 121 feet. Move the slider on the upper photo to see the decline in the reservoir elevation during this time. The decline in water elevation has exposed a white band of mineralized rock around the shoreline. The declining reservoir level has also exposed portions of Hoover Dam’s four intake towers, two on the right side and two on the left side. These intake towers channel water from Lake Mead into penstocks that serve Hoover Dam's 17 hydroelectric generators. Water moves through the generators, creating electricity on the way, and is released back into the Colorado River below the dam.
The lower photos show the conditions of Lake Mead and the upstream face of Hoover Dam in 2001 at an elevation of 1,196 feet (left photo) and the conditions in June 2015 at an elevation of 1,075 feet (right photo). The lower photos also show the Nevada spillway in the bottom right corner of the photos.
The Bureau of Reclamation estimates that every 1-foot drop in the elevation of Lake Mead reduces Hoover Dam’s powerplant capacity by approximately 5.7 megawatts. Since Lake Mead was last full in 2000, Hoover Dam’s powerplant capacity has fallen from 2,074 to 1,563 megawatts (as of August 2015). The Bureau of Reclamation has mitigated some of this impact by replacing traditional turbines with “wide-head” turbines, which are capable of generating more efficiently at lower reservoir levels, and making significant efficiency improvements to the powerplant.
At Lake Powell, the generating capacity of the Glen Canyon Dam powerplant is put at risk by declining reservoir levels. Below an elevation of 3,490 feet, Glen Canyon Dam cannot generate power. Based on a Bureau of Reclamation analysis conducted in August 2015, the earliest that this elevation is projected to occur would be 2019 (there is about a 5 percent chance of this occurring). Since Lake Powell finished filling in 1980, its water-surface elevation declined to a maximum low elevation of 3,555 feet (33 percent of capacity) in April 2005, which was approximately 65 feet above the minimum power pool.
Read More >>
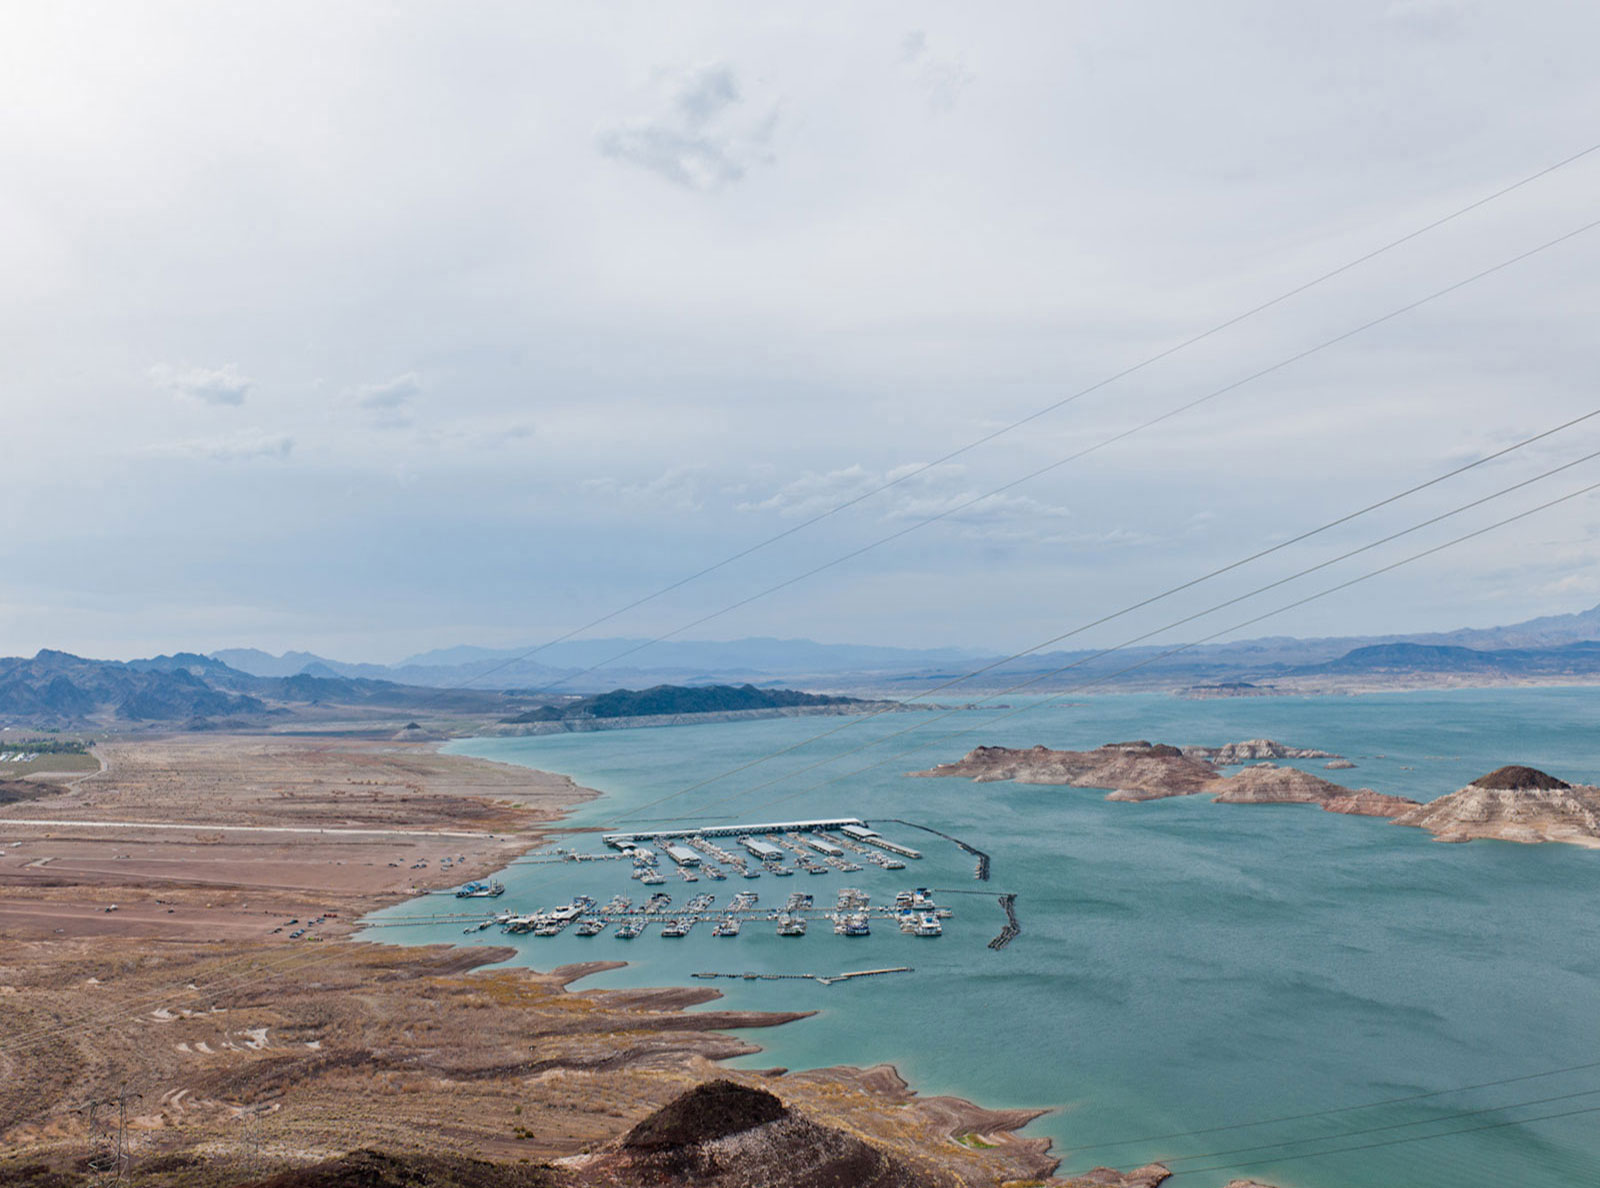
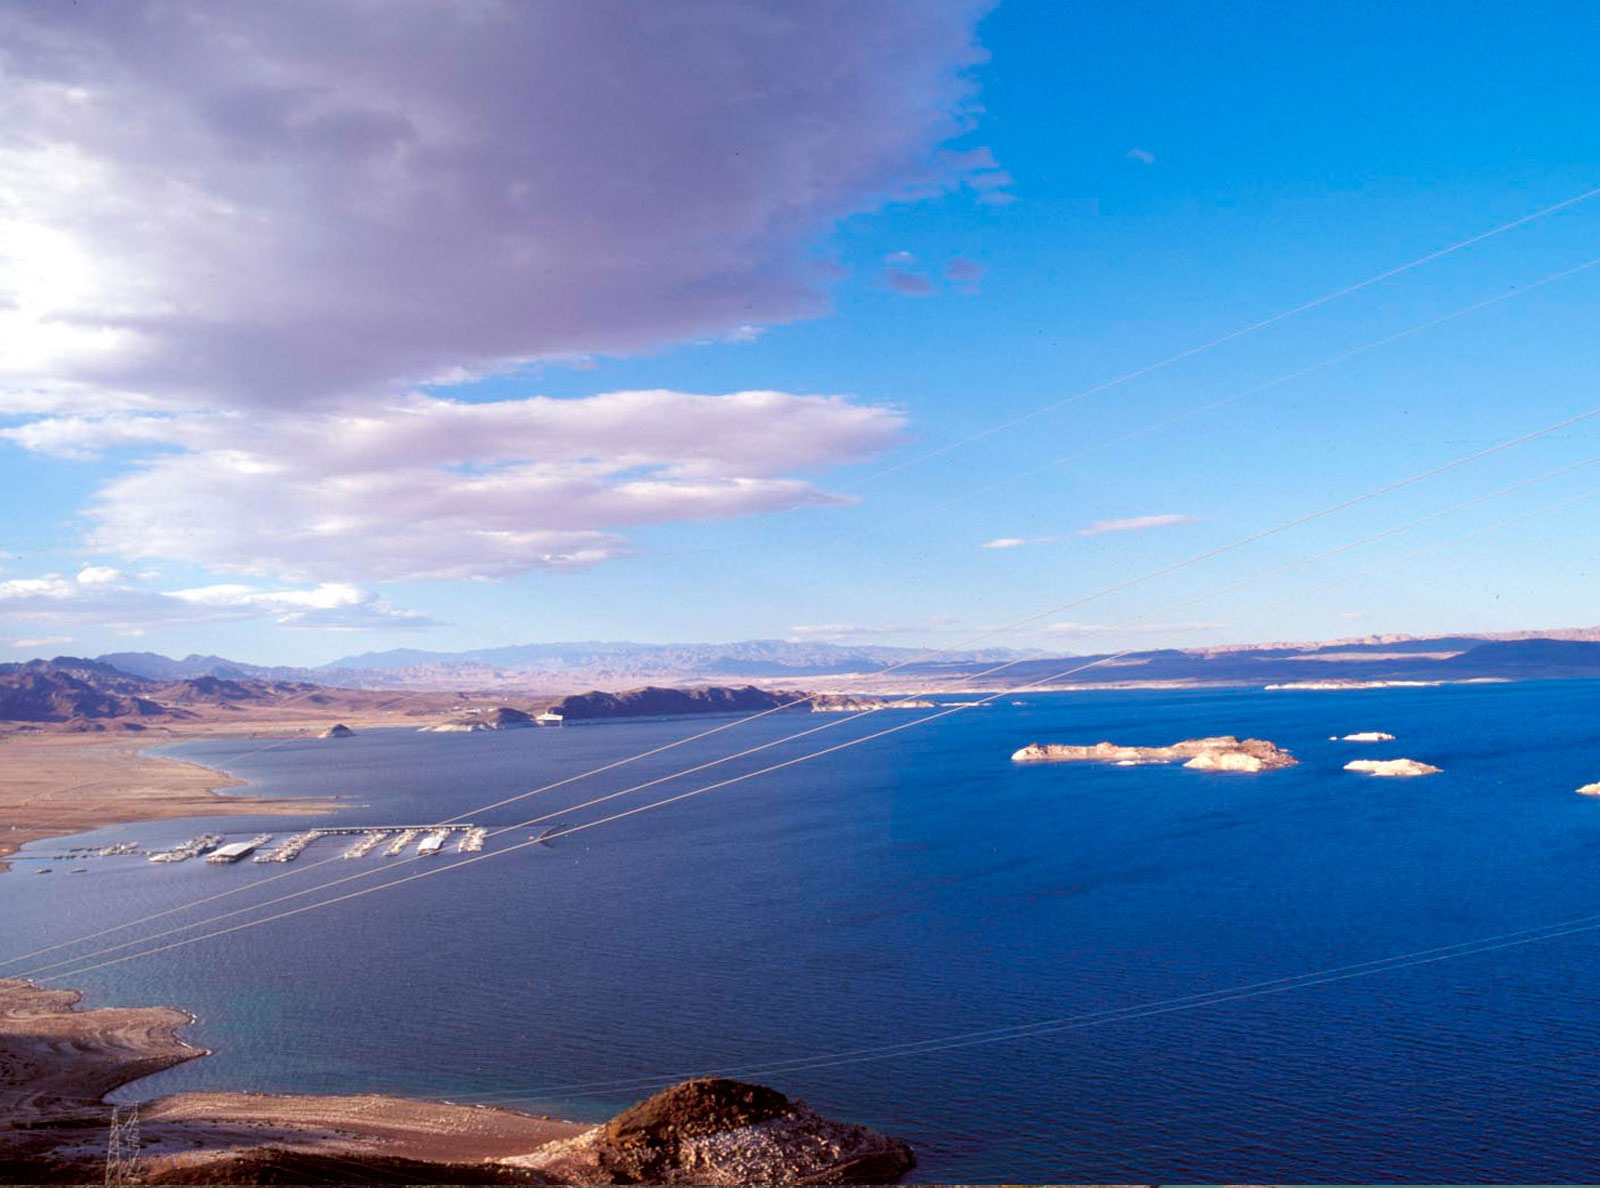
The photo slider above shows Hemenway Harbor, located in the southwestern portion of Lake Mead, and the location of Las Vegas Marina at an elevation of 1,152 feet in January 2003, and the new location of Las Vegas Marina at an elevation of 1,078 feet in May 2015. The photos also depict the increased exposure of Lake Mead’s shoreline and the emergence of the Boulder Islands, located on the right side of the photo, as the reservoir elevation has declined.
Lake Mead’s declining reservoir elevation has affected marinas and boat launching facilities at Lake Mead National Recreation Area, requiring the relocation of marinas and the extension of boat ramps to keep recreational facilities open. To continue to provide boat access as reservoir levels have declined, the National Park Service, responsible for the Recreation Area, has been extending boat ramps since 2002 and was expected to about spend $5 million extending ramps in 2015. In 2007, the Overton Beach Marina became inaccessible by water, and facilities from Overton Beach had to be moved to two other marinas, Callville Bay and Temple Bar. In 2008, Lake Mead Marina was moved from the location it had occupied since the 1960s to its current location in Hemenway Harbor.
In addition to impacting water supply, changing reservoir levels also influence the aquatic ecosystem. Water-level changes and natural disturbances, such as storm events and resulting local runoff, can re-suspend sediments. Because some Lake Mead sediments contain contaminants, re-suspension of sediment may be of concern to ecological health (Rosen et al., 2012).
Read More >>
Illia, T. 2010. Big Drop in Lake Mead Level Curbs Hoover Water, Power. ENR Southwest website.
Kuckro, R., 2014. Receding Lake Mead poses challenges to Hoover Dam's power output. E&E Publishing EnergyWire website.
Rosen, M.R., Turner, K., Goodbred, S.L., and Miller, J.M., eds., 2012, A Synthesis of Aquatic Science for Management of Lakes Mead and Mojave: U.S. Geological Survey Circular 1381, 162 p.
In keeping with the Bureau of Reclamation 2007 Interim Guidelines, if Lake Mead's January 1 elevation is projected to be 1,075 feet or lower based on an August projection, a Lower Basin shortage condition would be determined. Monthly projections made by the Bureau of Reclamation through an operational model called the "24-Month Study" are used to set the operational conditions for Lake Mead and Lake Powell.
Continue with the visualization to learn more about Lake Mead's operational conditions, how operational conditions are determined, and the potential impacts of drought on water deliveries in the Lower Basin.
Hover over sections of the graph below to take a closer look
The graphic above shows Lake Mead's historical elevations (on a monthly basis) since 2000, projected elevations for 2016 and 2017, and annual operating conditions.
As Lake Mead's elevation declines, the Lower Basin comes closer to its first-ever shortage condition. Since the drought began in 2000, Lake Mead's elevation has dropped by nearly 140 feet, declining every year except in 2005 and 2011. The Bureau of Reclamation makes projections of Lake Mead elevations and summarizes them in the Colorado River Basin 24-Month Study reports. The 24-Month Study model simulates operations of 12 major reservoirs in the Colorado River Basin. The projections are used to support annual and monthly decisions about how to operate the system looking out 1 to 2 years. The annual operating conditions for Lake Mead and Lake Powell in the upcoming year are based on projected January 1 reservoir elevations from the August 24-Month Study consistent with the 2007 Record of Decision on Colorado River Interim Guidelines for Lower Basin Shortages and the Coordinated Operations for Lake Powell and Lake Mead (2007 Interim Guidelines ).
The 24-Month Study utilizes forecasted Upper Basin inflow hydrology (provided by the Colorado Basin River Forecast Center), projected reservoir operations, projected diversion and consumptive use schedules, and other factors, to generate a single scenario of potential reservoir conditions.
The 2007 Interim Guidelines, adopted in December 2007 and in effect through 2026, provide the approved procedure to determine operating conditions and annual releases from Lake Powell and Lake Mead throughout the full range of reservoir operations. The 2007 Interim Guidelines include criteria for implementing shortage and surplus conditions in the Lower Colorado River Basin. The January 1 projections and resulting annual operation for Lake Mead and Lake Powell are reported in the Annual Operating Plan for Colorado River Reservoirs (AOP) for the upcoming year. Current and previous years' AOPs can be found on the Bureau of Reclamation's website.
Read More >>
Lake Mead
The Colorado River is one of the primary sources of water for irrigation and domestic use in Arizona, southern California, southern Nevada, and portions of northwestern Mexico.
The Bureau of Reclamation's Lower Colorado Region keeps records of diversions, return flows, and consumptive use of water delivered from the mainstream of the Colorado River below Lees Ferry to entitlement holders within the Lower Colorado River Basin.
The pictogram above depicts average consumptive use by select Lower Colorado River water entitlement holders for the 5-year period from 2010-2014. Each blue block represents a volume of 100,000 acre-feet and partially shaded blue blocks represent volumes less than 100,000 acre-feet. Hover over the bars to see the average consumptive use (2010-2014) by select Lower Colorado River entitlement holders (highlighted in green).
The pictogram above depicts the elevation range (from approximately 1,200 to 1,229 feet) and annual water deliveries in the Lower Basin when Lake Mead is operating in a Flood Control Surplus Condition. When in flood control, Lake Mead's operations are coordinated with the U.S. Army Corps of Engineers, according to the 1984 Field Working Agreement between the Bureau of Reclamation and the U.S. Army Corps of Engineers. Per the 1944 U.S.-Mexico Water Treaty, when Lake Mead is operating in flood control, an additional 200,000 acre-feet of water will be delivered to Mexico for a total annual delivery of 1.7 million acre-feet. Hover over the blue squares and states to see detailed delivery information.
A Quantified Surplus Condition or Domestic Surplus Condition exists when Lake Mead's January 1 elevation for the upcoming year is projected to be between 1,145 feet and approximately 1,200 feet. In a surplus condition, entitlement holders in the Lower Basin may take delivery of additional water, as allowed within their entitlements. As agreed to under Minute 319 to the 1944 U.S.-Mexico Water Treaty, Mexico may also take delivery of additional water within this elevation range. Hover over the blue squares and states to see detailed delivery information.
Please visit the International Boundary and Water Commission website to learn more about the 1944 U.S.-Mexico Water Treaty and Minute 319 (in effect through 2017).
Read More >>
A Normal Condition or Intentionally Created Surplus (ICS) Surplus Condition exists when Lake Mead's January 1 elevation for the upcoming year is projected to be between 1,075 and 1,145 feet. In a Normal/ICS Surplus Condition, water deliveries in the Lower Basin during the calendar year are limited to 7.5 million acre-feet (maf), plus or minus any credits for ICS creation or delivery. Hover over the blue squares and states to see detailed delivery information.
As agreed to in the 1944 U.S.-Mexico Water Treaty, when Lake Mead is not in a Flood Control Condition, water deliveries to Mexico during the calendar year are limited to 1.5 maf, plus or minus any water deferred, Intentionally Created Mexican Allocation (ICMA) created, or additional water delivered under terms of Minute 319.
Read More >>
Consistent with the 2007 Interim Guidelines, a Lower Basin Level 1 Shortage Condition exists when Lake Mead's January 1 elevation is projected to be between elevations 1,050 and 1,075 feet. Annual deliveries for Nevada and Arizona are reduced by 13,000 acre-feet and 320,000 acre-feet, respectively. Yellow boxes indicate delivery reductions to states. Hover over the blue squares and states to see detailed delivery information.
Under the terms of Minute 319, when Lake Mead's January 1 elevation is projected to be between elevations 1,050 and 1,075 feet, Mexico's annual delivery may be reduced by 50,000 acre-feet. This reduction may be offset by delivery of water deferred under Minute 319 for a total annual delivery of 1.5 million acre-feet.
Read More >>
Consistent with the 2007 Interim Guidelines, a Level 2 Shortage Condition exists when Lake Mead's January 1 elevation is projected to be between elevations 1,025 and 1,050 feet. Annual deliveries for Nevada and Arizona are reduced by 17,000 acre-feet and 400,000 acre-feet, respectively. Yellow boxes indicate delivery reductions to states. Hover over the blue squares and states to see detailed delivery information.
Under the terms of Minute 319, when Lake Mead's January 1 elevation is projected to be between elevations 1,025 and 1,050 feet, Mexico's annual delivery may be reduced by 70,000 acre-feet. This reduction may be offset by delivery of water deferred under Minute 319 for a total annual delivery of 1.5 million acre-feet.
Read More >>
Consistent with the 2007 Interim Guidelines, a Level 3 Shortage Condition exists when Lake Mead's January 1 elevation is projected to be below an elevation of 1,025 feet. Annual delivery reductions for Nevada and Arizona are 20,000 acre-feet and 480,000 acre-feet, respectively. In addition, if Lake Mead is below an elevation of 1,025 feet, the Secretary of the Department of Interior is required to consult with the seven Colorado River Basin States to consider further measures that may be taken under applicable Federal law. Yellow boxes indicate delivery reductions to states. Hover over the blue squares and states to see detailed delivery information.
Under the terms of Minute 319, when Lake Mead's January 1 elevation is projected to be below an elevation of 1,025 feet, Mexico's annual delivery may be reduced by 125,000 acre-feet. This reduction may be offset by delivery of water deferred under Minute 319 for a total annual delivery of 1.5 million acre-feet.
Read More >>
National Oceanic and Atmospheric Administration Colorado River Basin River Forecast Center
U.S. Geological Survey Stream Gage Information
Bureau of Reclamation Reclamation's Colorado River Basin 24-Month Study reports
Upper Colorado Region Water Operations website
In the Colorado River Basin, stakeholders, States, and Federal and local agencies are collaborating to develop creative strategies to reduce the impacts of drought and increase reservoir storage at Lake Powell and Lake Mead. Activities related to drought response include a system conservation program and drought contingency planning efforts in both the Upper and Lower Basins. Additional ongoing activities are being conducted with stakeholders through the Basin Study Moving Forward process and with Native American Tribes through the Ten Tribes Partnership Tribal Water Study. Lastly, the implementation of Minute 319 and related binational discussions also underscore the importance of the partnership and continued collaboration between the United States and Mexico.
Pilot System Conservation Program
In 2014, an $11 million funding agreement for a Pilot System Conservation Program (PSCP) was executed among the Bureau of Reclamation, Central Arizona Water Conservation District (CAWCD), The Metropolitan Water District of Southern California (MWD), Denver Water (DW), and the Southern Nevada Water Authority (SNWA) (the Funding Partners). The PSCP establishes a mechanism for funding the creation of Colorado River system water through voluntary water conservation actions and reductions in water use beginning in 2015 and continuing through at least 2016. The purpose of the PSCP is to explore the effectiveness of voluntary measures that could be used, when needed, to help maintain water levels in Lake Powell and Lake Mead above critical levels. All water conserved as a result of the pilot program would be considered Colorado River system water. Proposals under the PSCP have been received from potential program participants in both the Upper and Lower Basins, where execution of implementation agreements began in 2015 and is ongoing.
Drought Contingency Planning
The Bureau of Reclamation also works with Arizona, California, and Nevada to identify proactive steps to lower the risk of reaching critical elevations at Lake Mead. A step forward was a Memorandum of Understanding (MOU) for a Pilot Drought Response Actions signed by the Bureau of Reclamation and several water agencies in the Lower Basin States in December 2014. The MOU outlines a commitment by the parties to use best efforts to generate between 1.5 and 3.0 million acre-feet (maf) of additional water in Lake Mead through 2019. The Bureau of Reclamation, MWD, SNWA, and CAWCD have agreed to take first steps to generate 0.740 maf of the additional water by the end of 2017. The MOU is an important first step forward and collaboration continues on potential longer term options.
In the Upper Basin, Colorado, New Mexico, Utah, and Wyoming are pursuing a plan with three major components: 1) extended operations of the Colorado River Storage Project (CRSP) reservoirs, 2) voluntary demand management (e.g., fallowing or deficit irrigation), and 3) augmentation (primarily weather modification, such as cloud seeding). The Bureau of Reclamation, in collaboration with the Upper Basin States, has conducted modeling that indicates extended operations of the Upper Basin CRSP reservoirs to move water to Lake Powell can significantly reduce the probability of Lake Powell falling below critical elevations. The Bureau of Reclamation and the Upper Basin States are developing an extended operations plan and implementation agreement. It is anticipated that these will be completed by the end of 2016.
In addition to the previously mentioned activities, Congress has authorized additional funding through the Bureau of Reclamation for drought-related activities to increase Colorado River system water in Lake Mead, Lake Powell, and other Colorado River system reservoirs for the benefit of the system. This authorization requires that a report evaluating the effectiveness of the water conservation pilot projects be submitted to Congress in 2018, including a recommendation on whether the activities undertaken by the pilot projects should be continued.
The Moving Forward Effort
In May 2013, the Bureau of Reclamation and Basin stakeholders initiated the Moving Forward effort to build on future considerations and next steps identified in the Colorado River Basin Study. The Moving Forward effort enhances the broad, inclusive stakeholder process demonstrated in the Basin Study with an ultimate goal of identifying actionable steps to address projected water supply and demand imbalances that have broad-based support and provide a wide range of benefits. The Moving Forward effort is being conducted in a phased approach. Phase 1 began with the formation of a Coordination Team and three multi-stakeholder workgroups that focus on water conservation, reuse and environmental and recreational flows. In May, 2015 the Phase 1 Report was published, which documents the activities and outcomes of the workgroups during this phase and includes opportunities for potential future action.
Tribal Water Study
Begun in late 2013, the Colorado River Basin Ten Tribes Partnership Tribal Water Study is a cooperative effort with the Ten Tribes Partnership, whose members hold a significant amount of quantified and unquantified Federal reserved water rights to the Colorado River and its tributaries. The study builds on the technical foundation of the Colorado River Basin Study by further assessing water supplies and demands for these Tribes and identifies tribal opportunities and challenges associated with the development of tribal water. This study is anticipated to be completed in 2016.
Binational Partnership
In November 2012, the United States and Mexico reached agreement on Minute 319 to the 1944 U.S.-Mexico Water Treaty. Minute 319 is a 5-year agreement (2013-2017) that provides for a series of joint cooperative actions between the United States and Mexico, including surplus sharing during higher Lake Mead conditions, reduced water deliveries during lower Lake Mead conditions, flexibility with the Intentionally Created Mexican Apportionment mechanism, opportunities for improved and more efficient infrastructure, and water for the environment. In 2014, a pulse flow of approximately 105,000 acre-feet was delivered to Mexico from March 23 through May 18 to benefit the riparian ecosystem in the Colorado River Delta. Implementation of the pulse flow also involved a monitoring component conducted by scientists and experts from the United States and Mexico to determine the environmental benefits of the pulse flow and the overall performance of the pilot project. With the success of the binational implementation of this project, the United States and Mexico hope to develop a new binational agreement in the spirit of continued collaboration to meet future water resources management challenges ahead.
Read More >>
Bureau of Reclamation System Conservation Pilot Program. October, 8, 2014 press release.
2014 Pilot System Conservation Program Agreement.
2014 Memorandum of Understanding for Lower Basin Pilot Drought Response Actions.
Colorado River Basin Moving Forward Activities.
Minute 319: Interior Secretary Salazar and Reclamation Commissioner Connor Join U.S. and Mexico Delegations for Historic Colorado River Water Agreement Ceremony.November 20, 2012 press release.


This product is an activity of the Advisory Committee on Water Information Open Water Data Initiative (OWDI), and was developed collaboratively by the Department of Interior, U.S. Geological Survey, and U.S. Bureau of Reclamation, and with contributions from the U.S. Environmental Protection Agency, Oregon State University, and the Western States Water Council. The OWDI seeks to integrate currently fragmented water information into a connected, national water data framework and leverage existing systems, infrastructure and tools to underpin innovation, modeling, data sharing, and solution development. Application design was inspired by the 2014 National Climate Assessment. Any use of trade, firm, or product names is for descriptive purposes only and does not imply endorsement by the U.S. Government.