Javascript is not enabled Skip to main content
U.S. flag

An official website of the United States government

Dot gov

The .gov means it’s official.
Federal government websites often end in .gov or .mil. Before sharing sensitive information, make sure you’re on a federal government site.

Https

The site is secure.
The https:// ensures that you are connecting to the official website and that any information you provide is encrypted and transmitted securely.

Water use in the U.S., 2015

How do we use water in the U.S.?

We all depend on water every day, ranging from the water from our faucets, to the food we eat, to much of the electricity we use. The U.S. and its territories used nearly 322 billion gallons of water per day in 2015. This would cover the continental U.S. in about two inches of water over the course of a year. The national breakdown of water withdrawals looks like this:

Each "pie slice" represents a portion of U.S. water withdrawals in 2015.

Although thermoelectric and irrigation are the dominant categories nationally, the county breakdown reveals regional variation. In the map below, you can see all categories for each county at once. While you can still see that irrigation and thermoelectric are the largest, there is a striking contrast between the East — where thermoelectric is dominant — and the West — where irrigation is dominant.

High water use: IL (steel), Northeast (power), AR & CA (irrigation), Gulf Coast (industry), cities (public), ID & AK (other)

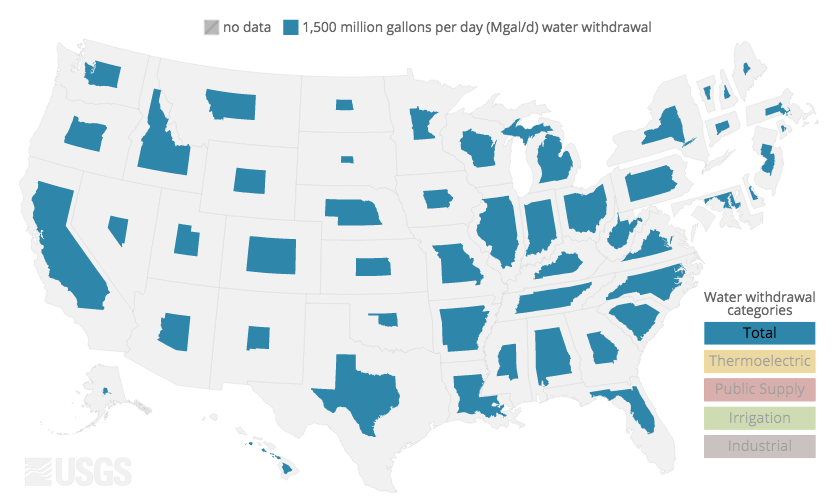
1. Public Supply water withdrawals, mostly for Domestic use, are highest in counties with large numbers of people.

2. Aquaculture, mining, self-supplied domestic, and livestock water uses are distributed unevenly across the US. There are large withdrawals for aquaculture along the Snake River in southern Idaho.

3. Larger withdrawals in Alaska in the “other” categories are for aquaculture and mining.

4a. Irrigation occurs in most areas of the country, but is larger in areas where rainfall is insufficient to meet crop what needs, such as in the drier parts of the West.

4b. Irrigation in eastern Arkansas provides water to flood rice fields as well as supplement rainfall to other crops.

5. Industrial withdrawals are driven by many factors. Industrial facilities for production of steel in Lake County, Indiana, are located on Lake Michigan, a large source of fresh water, with access to water and land transportation, and ore and coal deposits. Lake County accounts for 8% of the US industrial water withdrawals.

6. The Gulf Coast is another hotspot of industrial withdrawals for the chemical and petroleum industries.

7. Thermoelectric power plants use steam to drive turbines and generate electricity. In the eastern U.S. where water is relatively abundant, large volumes of water often are withdrawn, used once for cooling, then returned to the source a little warmer than before. In the western U.S., cooling water is more often withdrawn and recirculated many times, so less is withdrawn overall.

Read More

As a result of all these spatial differences in how we use water, total water use differs greatly among states. Can you guess where these three states rank in total water use?

Data Collection

Every 5 years since 1950, the USGS has compiled and estimated water-use information in cooperation with State, Federal, and local agencies to document how and where we use water. This information is essential to understand how future water demands will be met, while maintaining adequate water quality and quantities for human and ecosystem needs. The fourteenth report in this series, Estimated use of water in the United States in 2015, was released in June of 2018, along with the county-level data which supports the publication.

Read about the USGS Water Availability and Use Science Program

References

Dieter, C.A., Maupin, M.A., Caldwell, R.R., Harris, M.A., Ivahnenko, T.I., Lovelace, J.K., Barber, N.L., and Linsey, K.S., 2018, Estimated use of water in the United States in 2015: U.S. Geological Survey Circular 1441, 65 p., https://doi.org/10.3133/cir1441. [Supersedes USGS Open-File Report 2017-1131.]

Dieter, C.A., Linsey, K.S., Caldwell, R.R., Harris, M.A., Ivahnenko, T.I., Lovelace, J.K., Maupin, M.A., and Barber, N.L., 2017, Estimated use of water in the United States county-level data for 2015: U.S. Geological Survey data release, https://doi.org/10.5066/F7TB15V5.