Interactive Map of Delaware River Basin Stream Temperature Forecasts
viewof forecastDay = Inputs.range([0, forecastDates.length - 1], {
  value: 0,
  step: 1,
  label: "Forecast day"
})md` You are viewing forecasted maximum stream temperatures for ${formattedCurrentWeekday}, ${formattedCurrentDate}. You can click on a point below to see the 7-day forecast for that river site. River sites are referenced to the [National Geospatial Modeling Fabric.](https://www.sciencebase.gov/catalog/item/535eda80e4b08e65d60fc834)`map = {
// SET UP MAP
let container = DOM.element('div', { style: `width:${width}px;height:${width/1.6}px` });
yield container;
let map = L.map(container);// Don't set view here b/c using "fit bounds" below
// ADD BACKGROUND LAYERS
// add background map
let tileLayer = L.tileLayer('https://{s}.basemaps.cartocdn.com/light_all/{z}/{x}/{y}{r}.png', {
attribution: '© <a href="https://www.openstreetmap.org/copyright">OpenStreetMap</a> contributors © <a href="https://carto.com/attributions">CARTO</a>',
subdomains: 'abcd',
minZoom: 7,
maxZoom: 15
}).addTo(map);
// Add drb watershed polygon
let drbWshedLayer = L.geoJson(drbWshed, { //instantiates a new geoJson layer
weight: 1.5, //Attributes of polygon
color: "#525252",
opacity: 1,
fillColor: '#525252',
fillOpacity: 0.05
}).addTo(map); //Adds the layer to the map.
// add drb streams
const streamColor = '#91A8BE' // color of streams on base map under wshed poly
let drbStreamsLayer = L.geoJson(drbStreams, {
style: function(feature) {
switch (feature.properties.StrmOrd) {
case 1: return {color: streamColor, weight: 0.5};
case 2: return {color: streamColor, weight: 0.5};
case 3: return {color: streamColor, weight: 0.8};
case 4: return {color: streamColor, weight: 1.2};
case 5: return {color: streamColor, weight: 2};
case 6: return {color: streamColor, weight: 2.5};
case 7: return {color: streamColor, weight: 3};
case 8: return {color: streamColor, weight: 4};
}
}
}).addTo(map);
// ADD DATA LAYERS
// Define function to pull data for segment
const getSegData = function(seg_id) {
let seg_data = filteredForecastData.filter(function(seg_forecast) {
return seg_forecast.seg_id_nat == seg_id
})
return(seg_data)
}
// Define function to add pop-up with segment id and figure of forecast for each segment
var popupOptions =
{
'maxWidth': '556',
}
const addPopUp = function(feature, layer) {
let seg_data = getSegData(feature.properties.seg_id_nat)
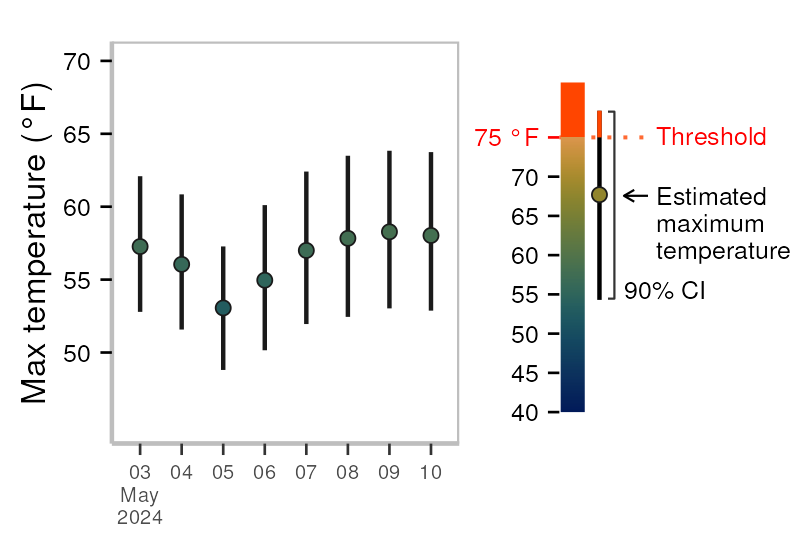
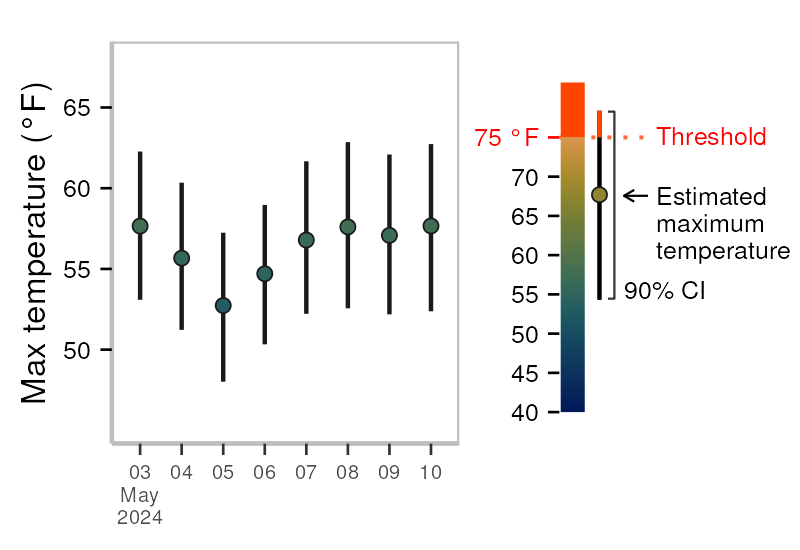
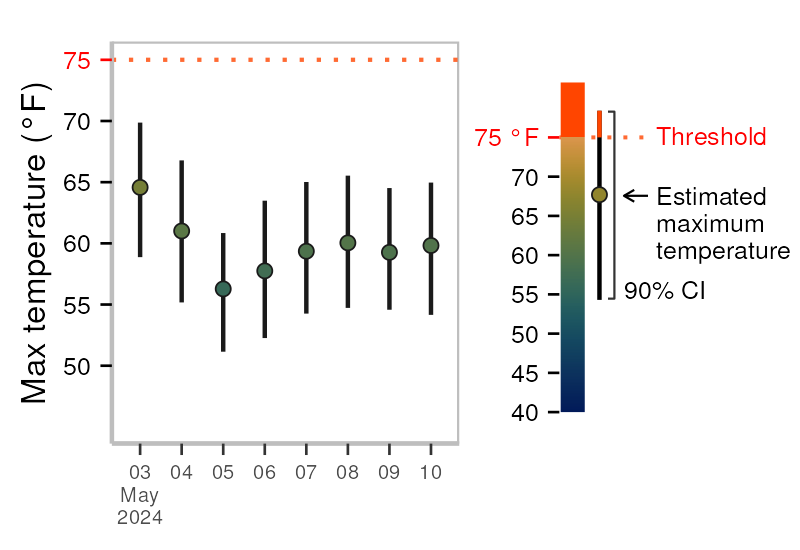
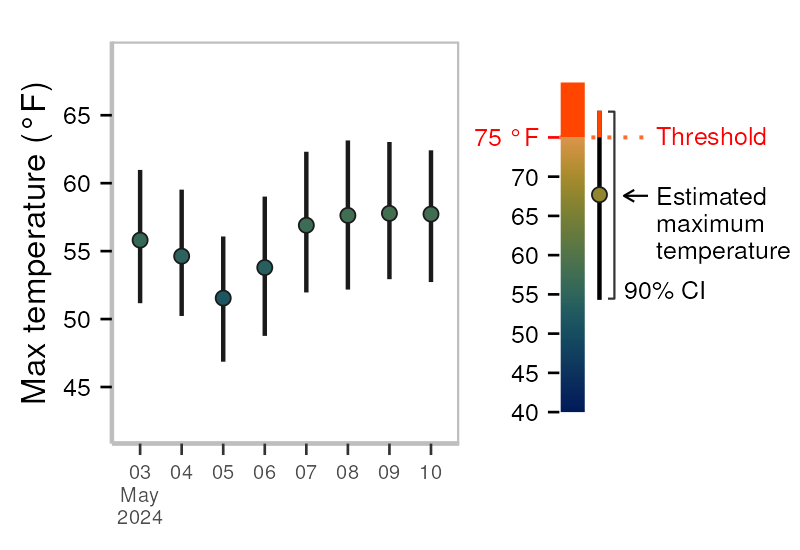
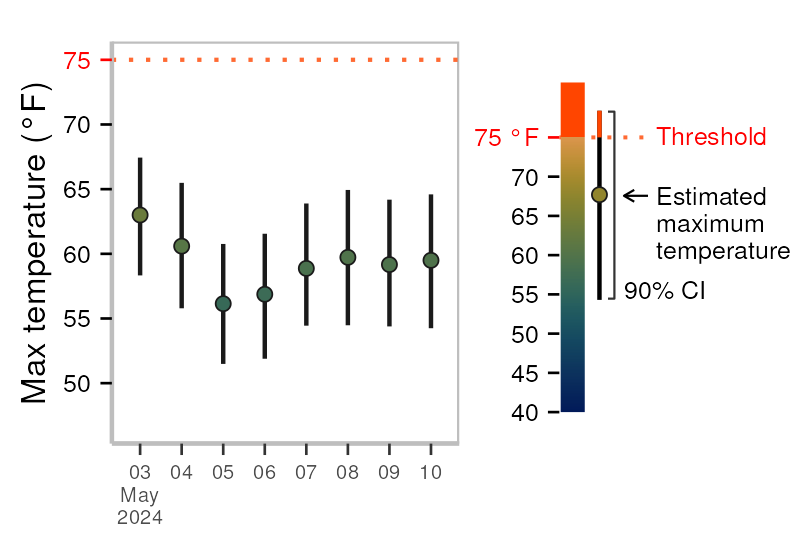
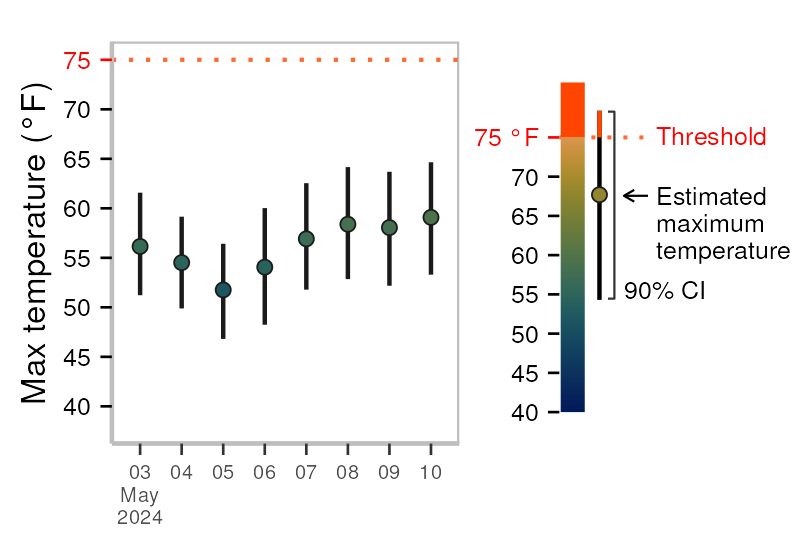
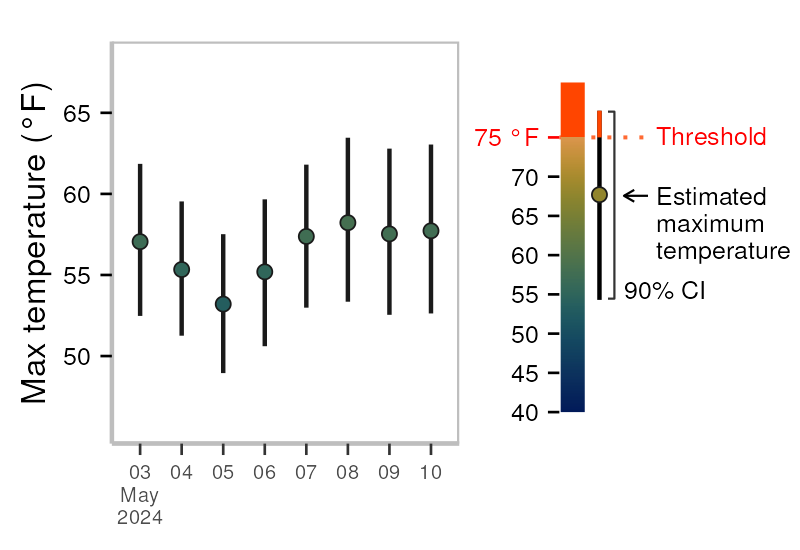
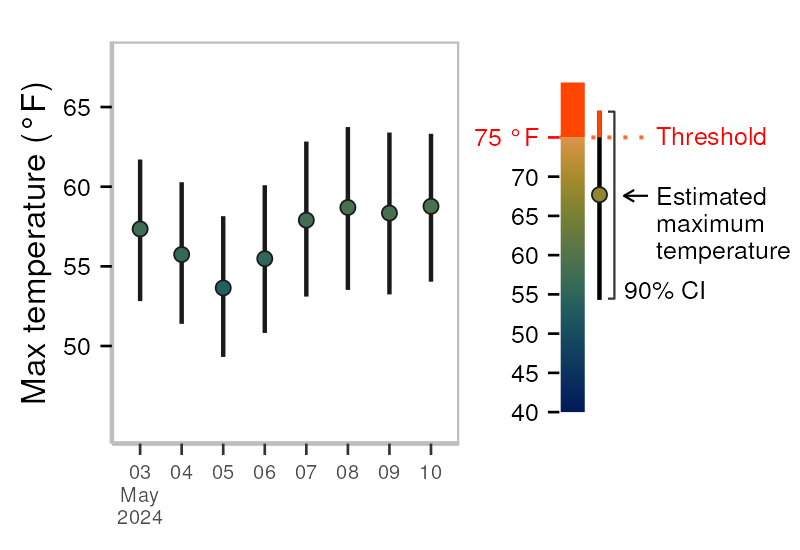
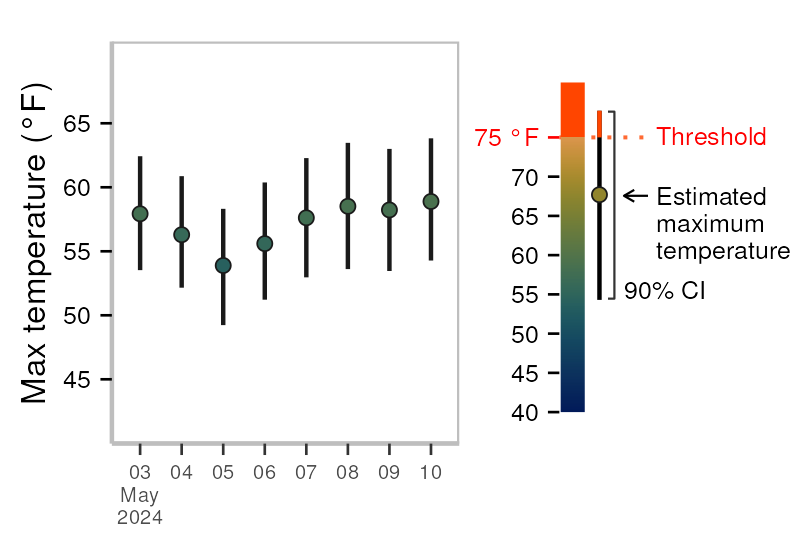
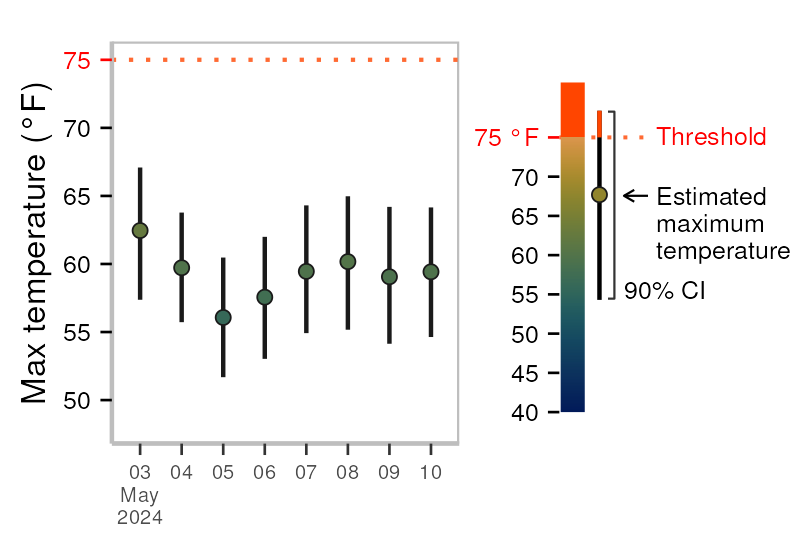
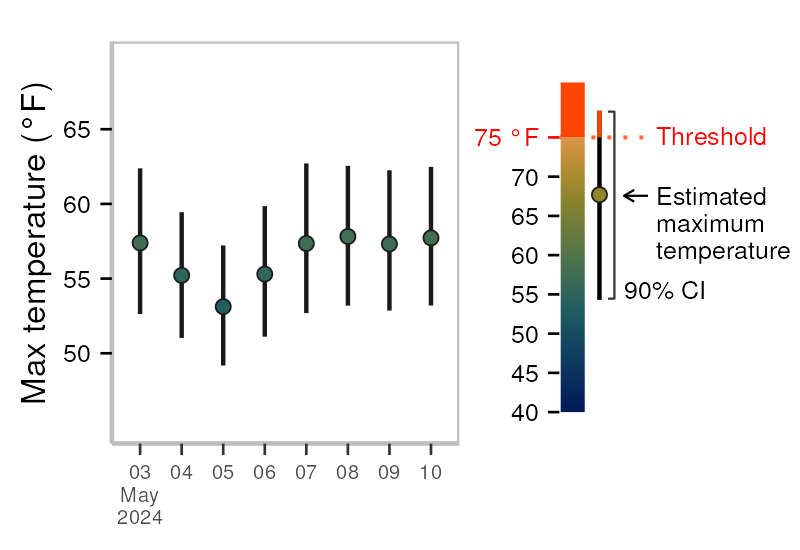
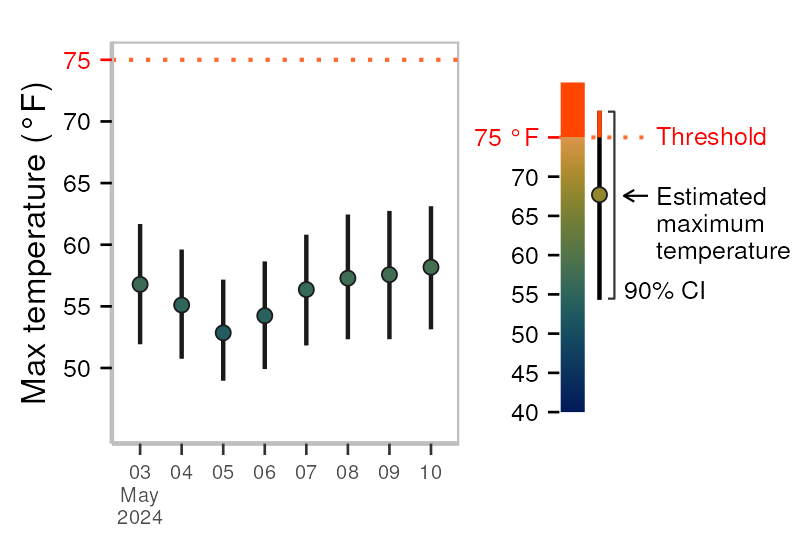
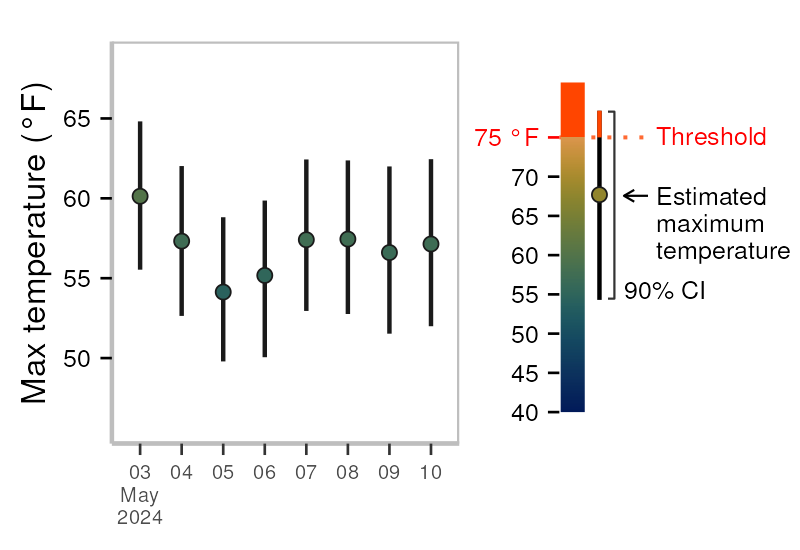
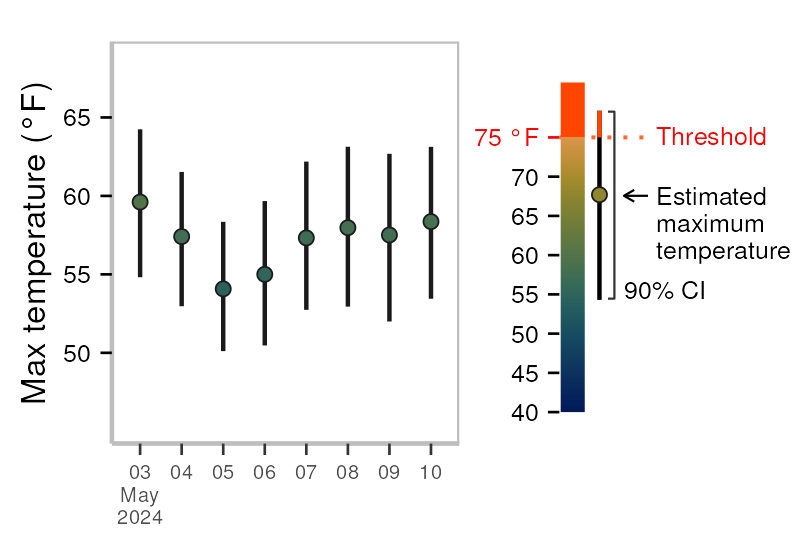
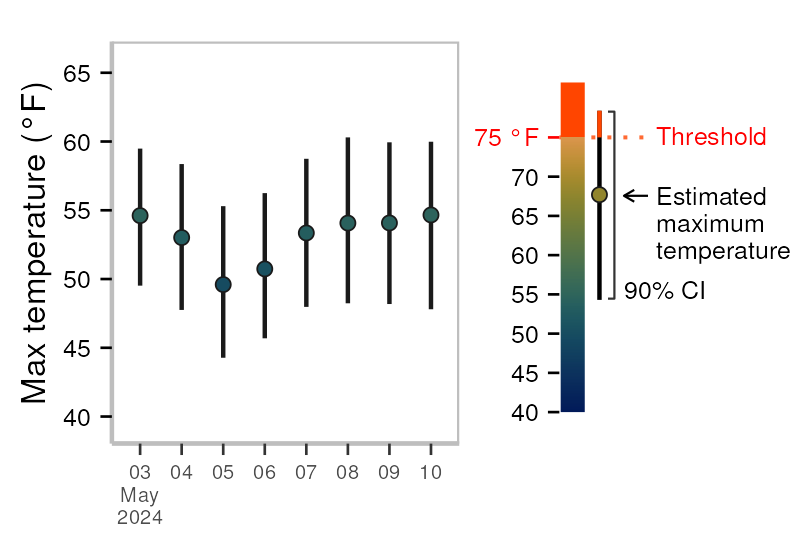
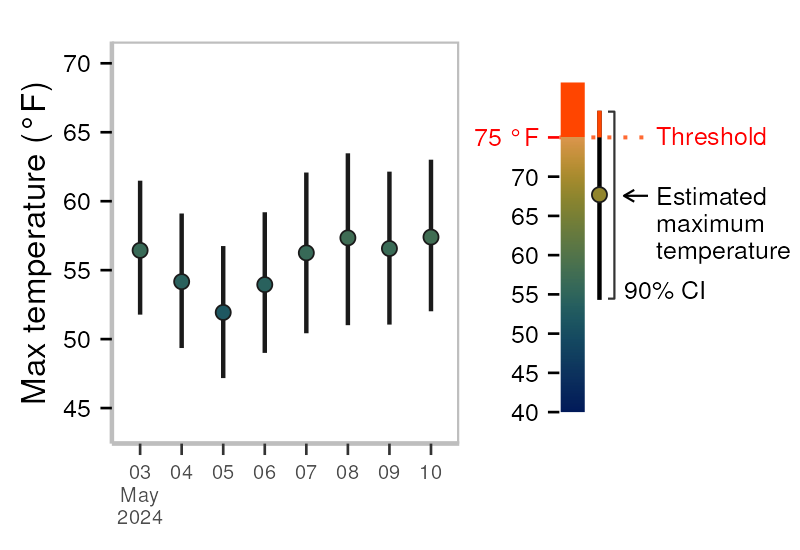
layer.bindPopup("<h3>Forecast issued " + formattedIssueDate + " for " + seg_data[0].site_label + "</h3>" +
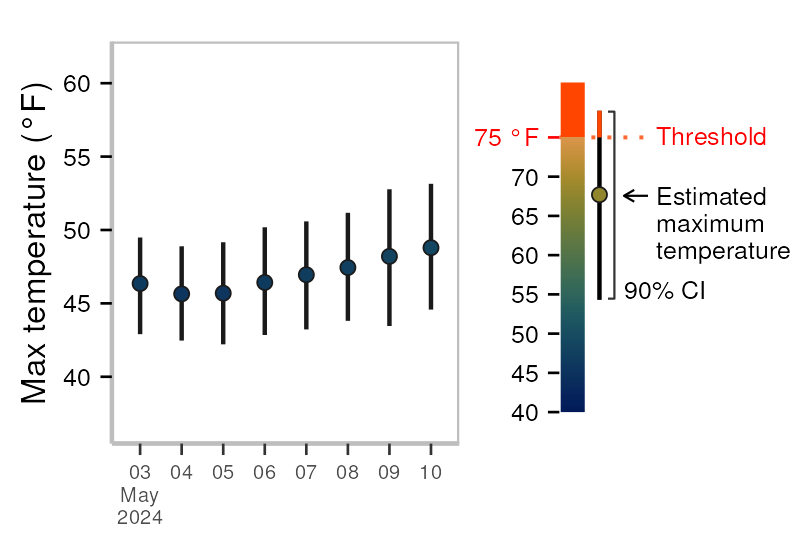
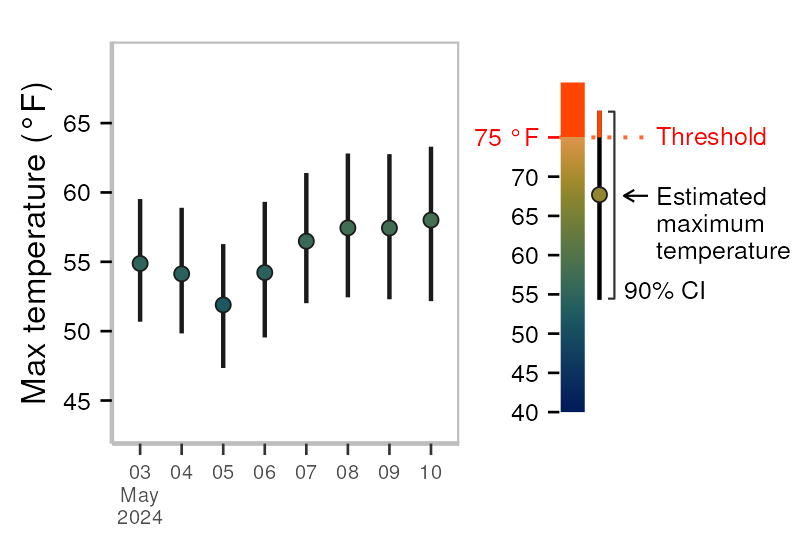
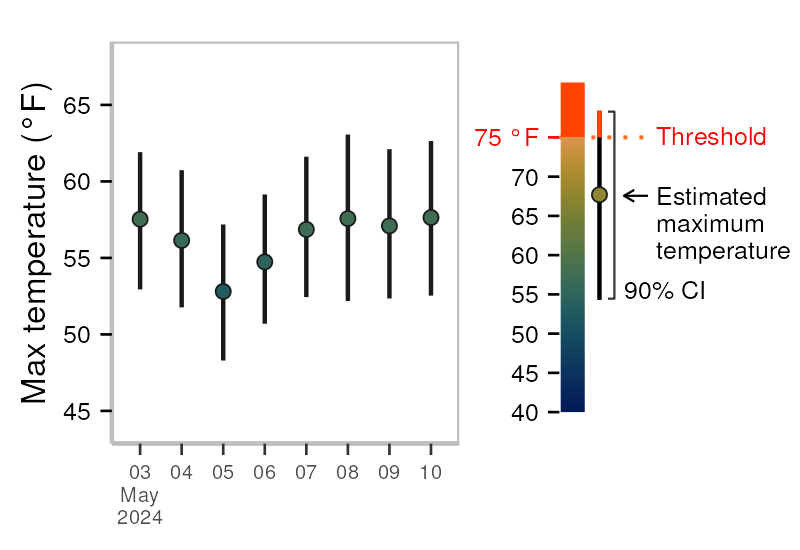
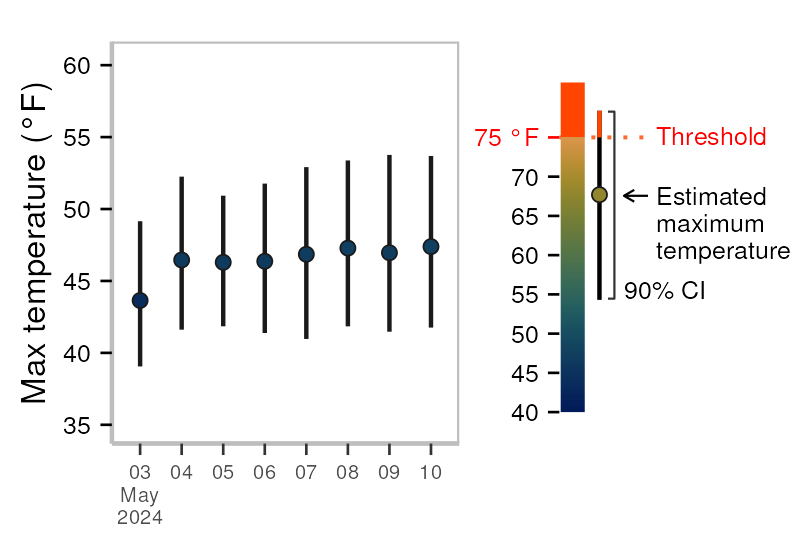
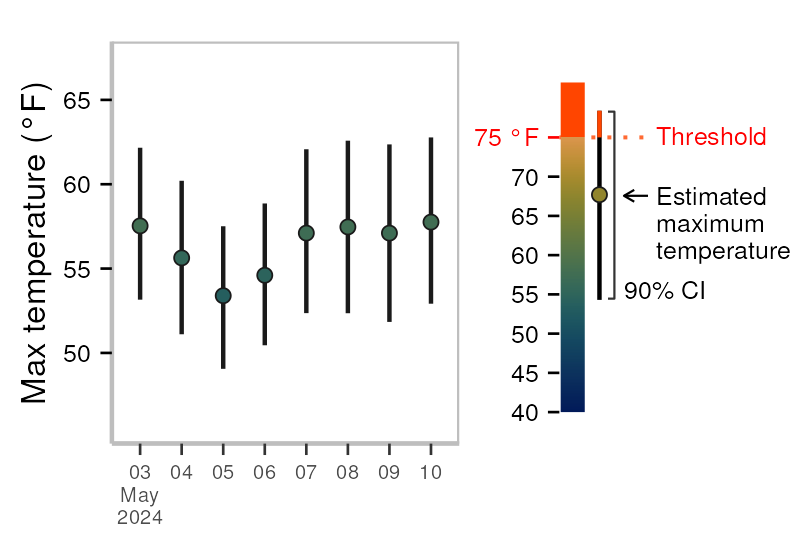
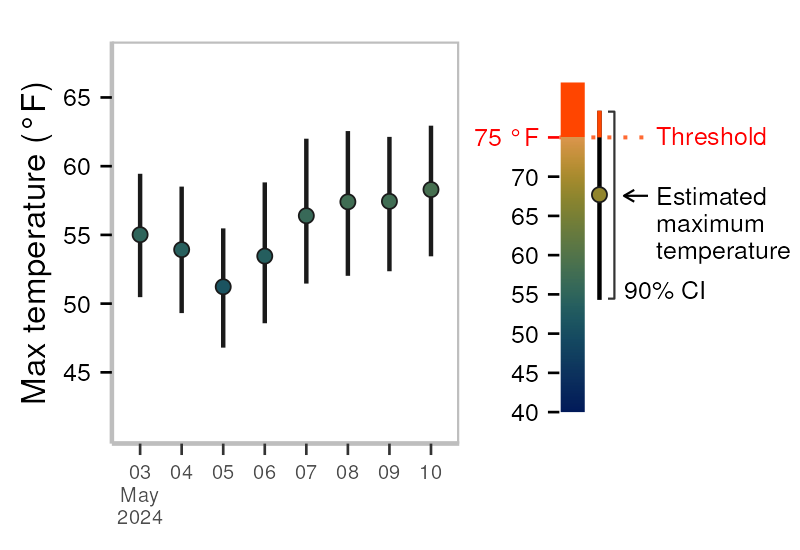
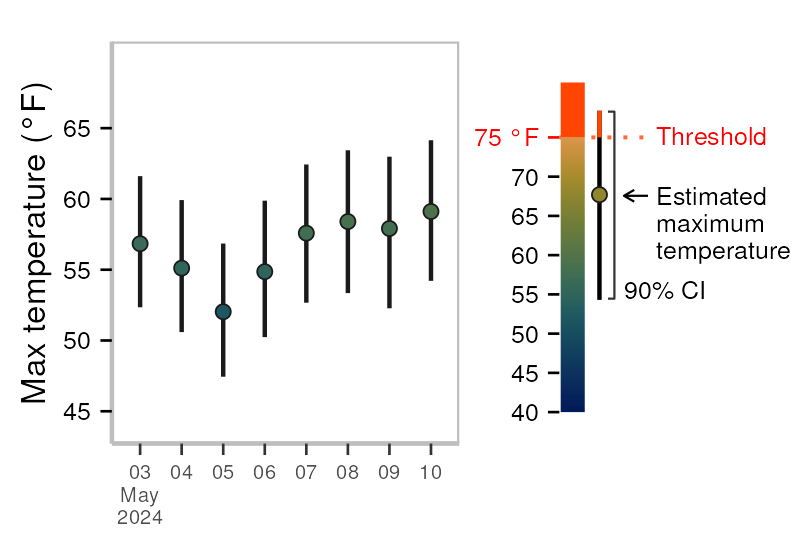
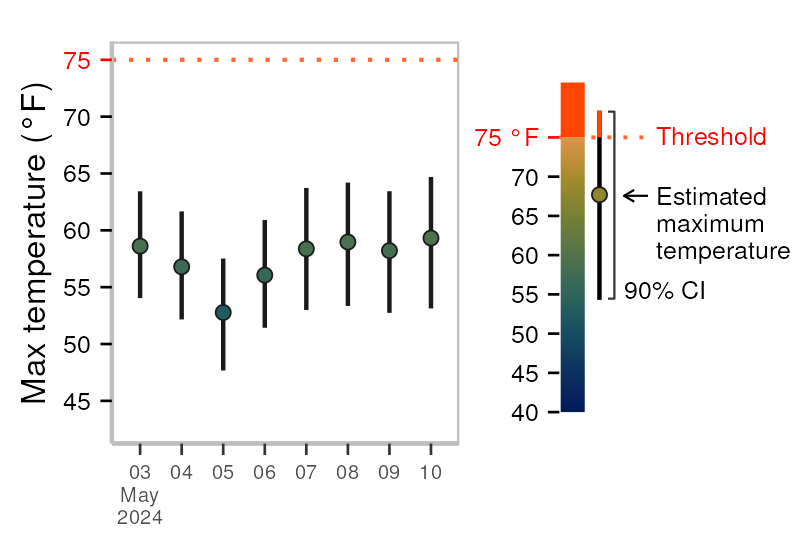
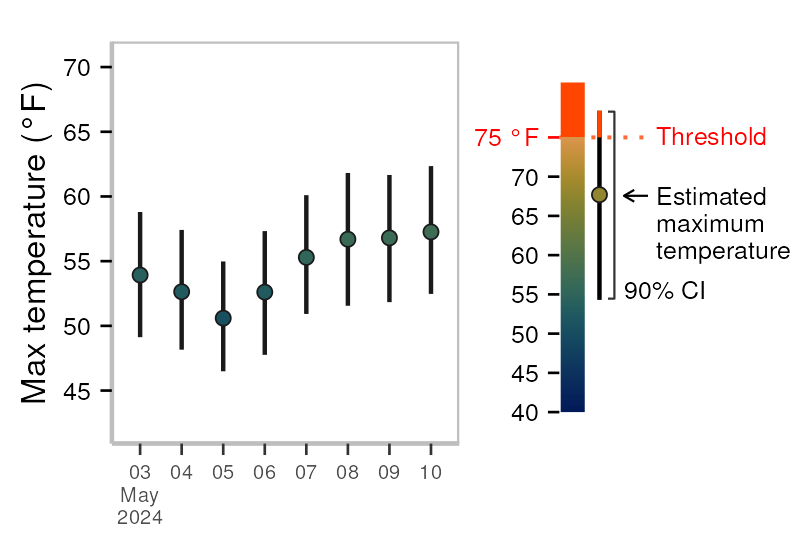
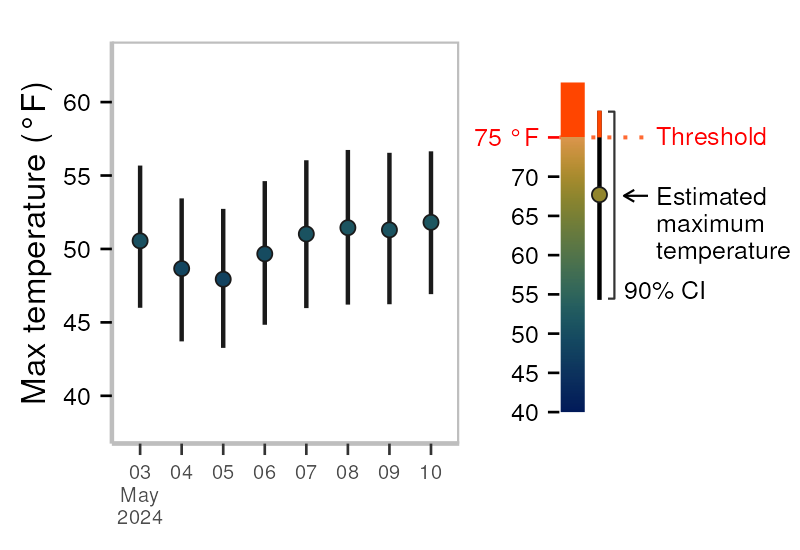
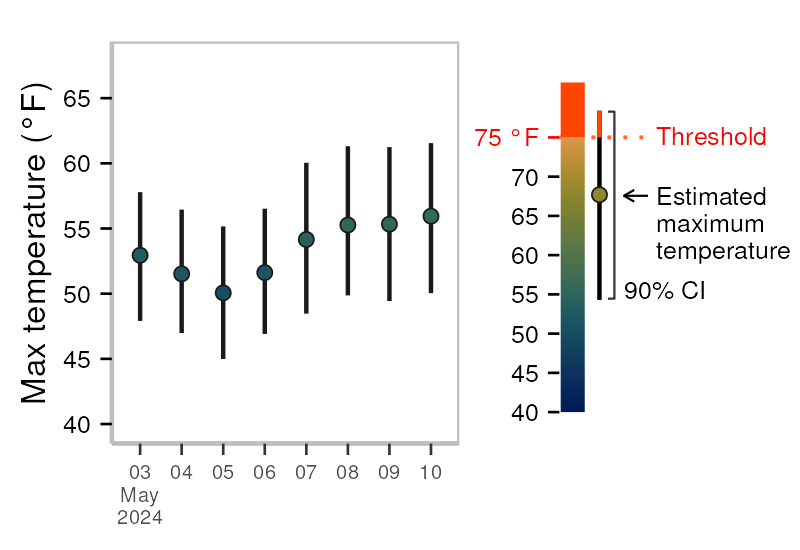
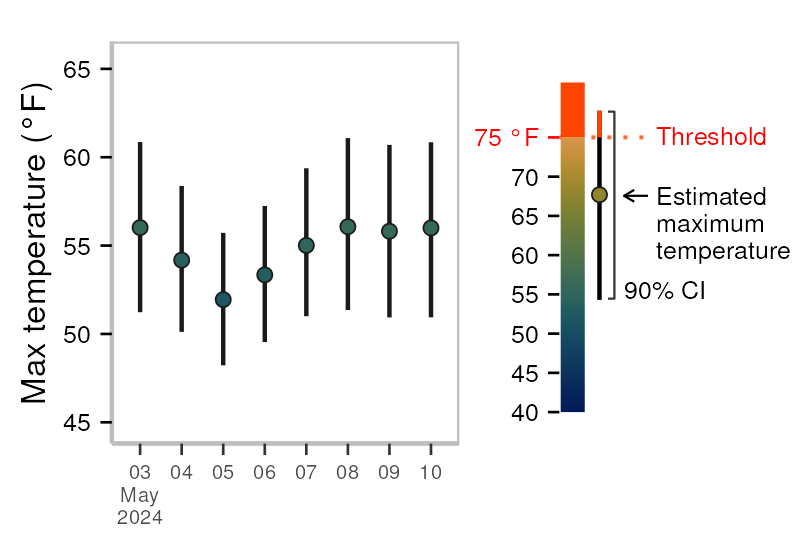
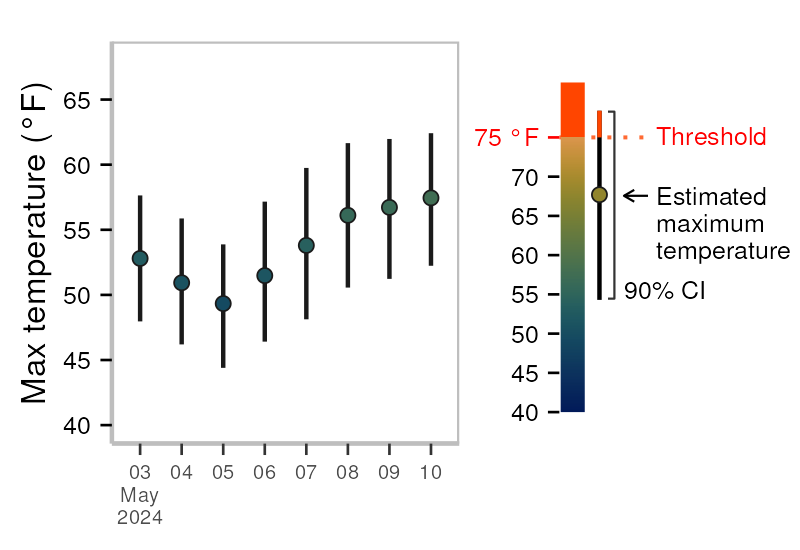
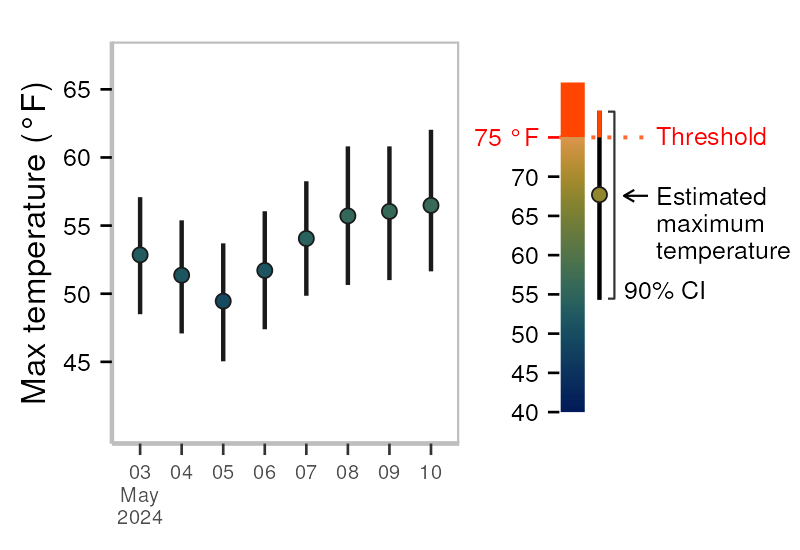
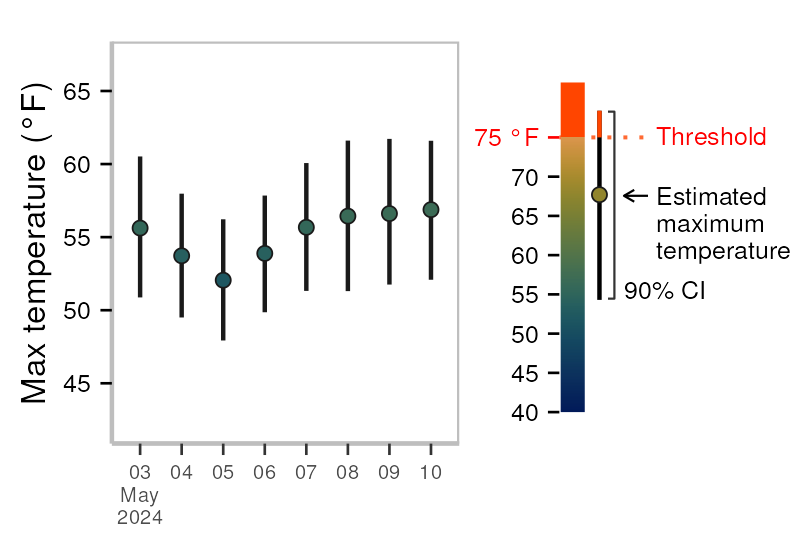
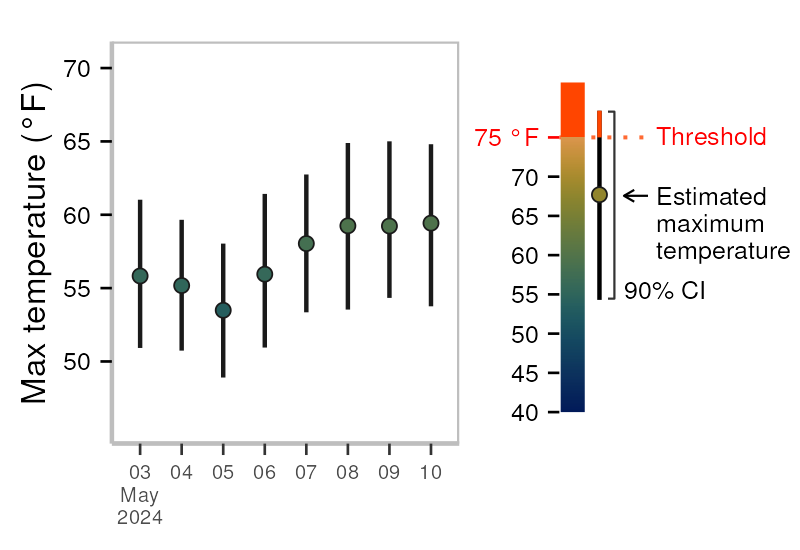
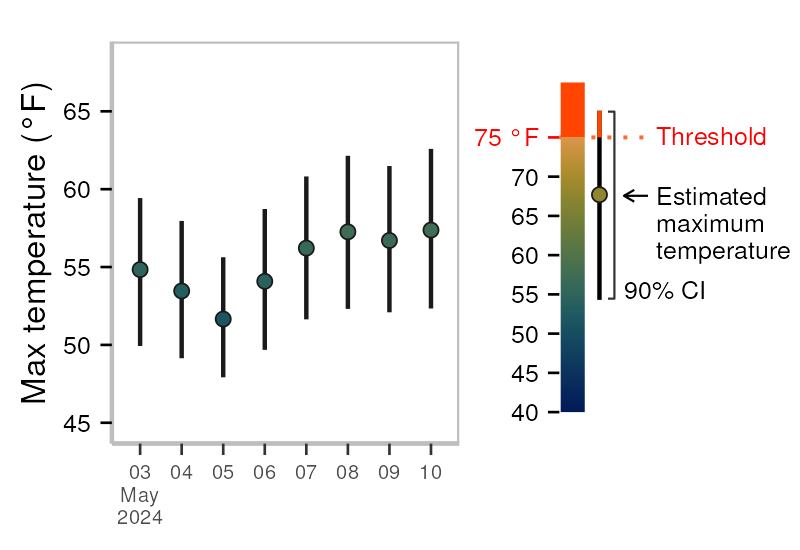
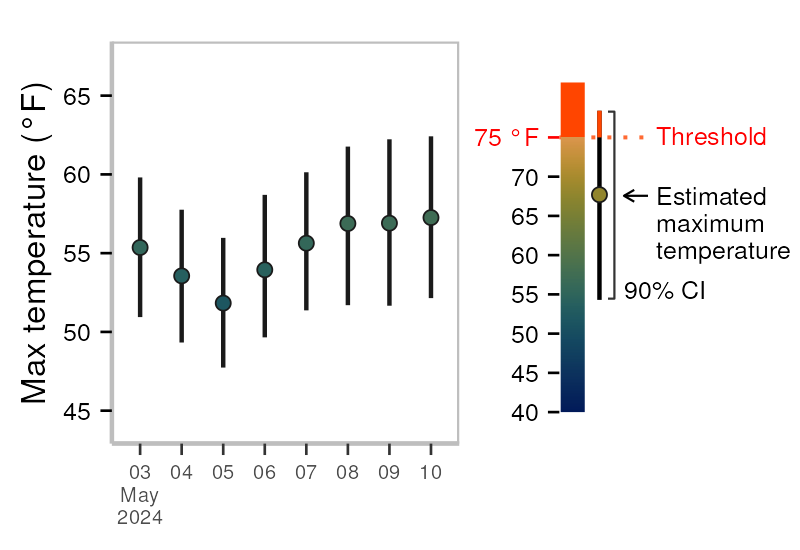
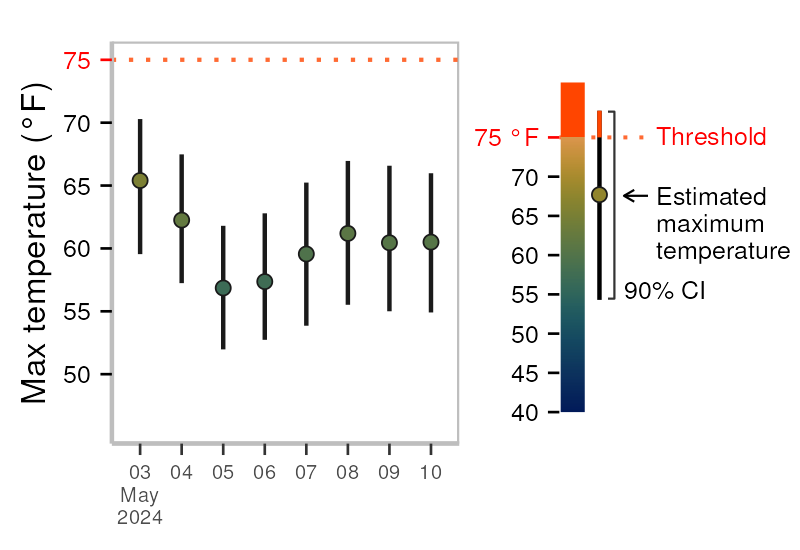
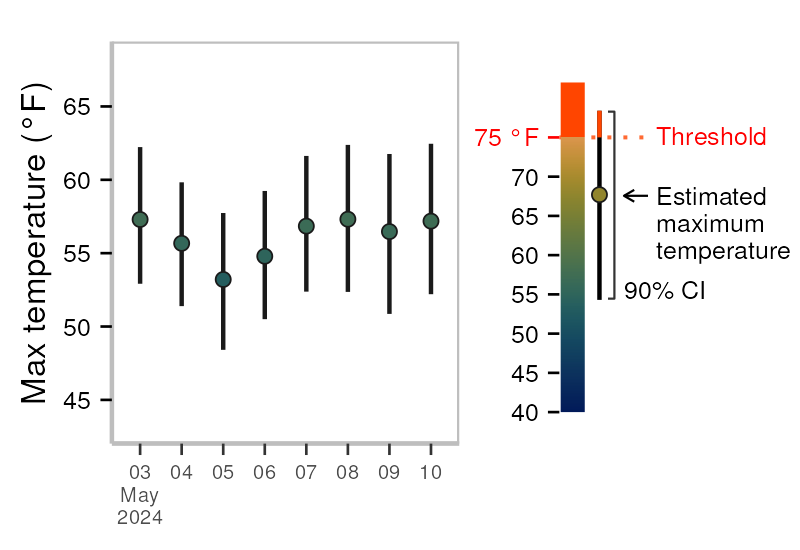
"<img src= 'out/daily_interval_" + layer.feature.properties.seg_id_nat + ".png' class=popup-image />",
popupOptions);
}
// Add invisible wide forecast segments to improve pop-up interaction
let forecastSegsLayerInvisible = L.geoJson(forecastSegs, {
weight: 10,
color: "#5B5B5B",
opacity: 0,
onEachFeature: addPopUp
}).addTo(map);
// Add forecast segments
let forecastSegsLayer = L.geoJson(forecastSegs, {
weight: 2,
color: "#00568F",
onEachFeature: addPopUp
}).addTo(map);
// Fit map view based on base layers
map.setMaxBounds(drbWshedLayer.getBounds().pad(1));
map.fitBounds(forecastSegsLayer.getBounds()); //sets map view to fit bounds of passed layer
// Add points for 5 priority sites
const prioritySitesSegIds = [1573, 1450, 1571, 1565, 1641]
const prioritySiteMarkerOptions = {
radius: 9,
fillColor: "#F2F1EF",
color: "#1A1A1A",
weight: 1,
opacity: 1,
fillOpacity: 1
};
let priorityForecastPointsLayer = L.geoJson(forecastPoints, {
filter: function(feature, layer) {
return prioritySitesSegIds.includes(feature.properties.seg_id_nat)
},
pointToLayer: function(feature, latlng) {
return L.circleMarker(latlng, prioritySiteMarkerOptions);
},
onEachFeature: addPopUp
}).addTo(map);
// Add forecast points
// colored by forecast temperature value
// Build color scale with d3
// colors vector defined using scico palette in R, below
// define color scale based on length of provided colors vector
const color = d3.scaleLinear()
.domain(d3.range(0, 1, 1.0/(colors.length)))
.range(colors)
// Use fixed temperature range to define color scale to convert temperatures
// to units of the color domain
const scaleTempValues = d3.scaleLinear()
.domain([40, tempThreshold - 0.00001]) // Fixed color scale
.range([0, 1])
// Function to pull forecast temp to pass to color function
function getTempColor(temp) {
if (temp >= tempThreshold) {return "#FF4500"}
else {return color(scaleTempValues(temp))}
}
// Pull temperature data for segment and get color from color scale
function colorByTemp(feature) {
let seg_data = getSegData(feature.properties.seg_id_nat)
let seg_temp = seg_data[0][tempVar]
return getTempColor(seg_temp)
}
// Add points
const siteMarkerOptions = {
radius: 6,
color: "#1A1A1A",
weight: 1,
opacity: 1,
fillOpacity: 1
};
let coloredForecastPointsLayer = L.geoJson(forecastPoints, {
pointToLayer: function(feature, latlng) {
siteMarkerOptions['fillColor'] = colorByTemp(feature)
return L.circleMarker(latlng, siteMarkerOptions);
},
onEachFeature: addPopUp
}).addTo(map);
// Add legend
// Build arrays with integer increments for use in legend based on domain of temp values
const tempValues = transposedForecastData.map(d => d[tempVar])
const tempExtent = d3.extent(tempValues)
const lowerBoundArray = [...Array(Math.round(tempExtent[0])).keys()]
const higherBoundArray = [...Array(Math.round(tempExtent[1]) + 1).keys()] // add 1 b/c not inclusive
const domainArray = higherBoundArray.filter(x => !lowerBoundArray.includes(x))
// Build array of values divisible by 5 for legend labels
let legendArray = domainArray.filter(x => x % 5 == 0)
// filter legend array to exclude values *above* threshold
legendArray = legendArray.filter(value => value <= tempThreshold)
// Pull domain and legend arrays that exclude values at and above threshold
let legendArrayUnderThreshold = legendArray.filter(value => value < Math.round(tempThreshold))
let domainArrayUnderThreshold = domainArray.filter(value => value < Math.round(tempThreshold))
// append a div to the legend control div
const svgDiv = d3.select('.leaflet-control-container').select('.leaflet-top.leaflet-right')
.append('div')
.attr("class", "temp-legend leaflet-control")
.attr("id", "legend-container")
// select first link in attribution
const attribution = d3.select('.leaflet-control-container').select('.leaflet-control-attribution a')
.attr("href", "https://github.com/Leaflet")
// add legend title
svgDiv.append('h5')
.text('Maximum stream temperature (°F)')
// define legend sizing parameters
const gradientBarWidth = 20;
const gradientBarHeight = 110;
// Append an svg to hold the legend elements
const svgHeight = legendArray.includes(Math.round(tempThreshold)) ? gradientBarHeight+gradientBarWidth + 10 + 'px' : gradientBarHeight + 10 + 'px'
const svg = svgDiv.append("svg")
.attr("id", "legend-svg")
.attr("height", svgHeight)
.attr("width", "100%")
// Add a group to hold the elements and translate
const legendItemYOffset = 5
const legendGroup = svg.append("g")
.attr("transform", "translate(0," + legendItemYOffset + ")")
.attr("id", "temp-legend")
// define gradient for legend
let defs = svg.append("defs")
.append("linearGradient")
.attr("id", "gradient-color")
.attr("x1", "0%")
.attr("y1", "100%")
.attr("x2", "0%")
.attr("y2", "0%")
.selectAll("stop")
.data(domainArrayUnderThreshold)
.enter().append("stop")
.attr("offset", function(d,i) {
return i/(domainArrayUnderThreshold.length-1);
})
.attr("stop-color", function(d) {
return getTempColor(d)
})
// If values exceed threshold, add legend group for temps at and above threshold
let y_buffer = 0;
if (legendArray.includes(Math.round(tempThreshold))) {
const overThresholdGroup = legendGroup.append("g")
.attr("id", "over-threshold-group")
y_buffer = gradientBarWidth + 15;
overThresholdGroup.append("rect")
.attr("width", gradientBarWidth)
.attr("height", gradientBarWidth)
.attr('fill', getTempColor(tempThreshold))
overThresholdGroup.append("text")
.attr("x", gradientBarWidth + 5)
.attr("y", gradientBarWidth/2)
.attr("dy", "0.3em")
.text(`${Math.round(tempThreshold)}` + ' +')
}
// Add legend group for temps below threshold
const underThresholdGroup = legendGroup.append("g")
.attr("id", "under-threshold-group")
.attr("transform", "translate(0," + y_buffer + ")")
// Append legend rectangle for color gradient for temps below threshold
underThresholdGroup.append("rect")
.attr("class", "gradientLegend")
.attr("width", gradientBarWidth)
.attr("height", gradientBarHeight)
.attr("fill", "url(#gradient-color)")
.attr("x", 0)
.attr("y", 0)
// Add labels for the gradient
const labelScale = d3.scaleLinear()
.range([gradientBarHeight, 0])
.domain(d3.extent(domainArrayUnderThreshold))
// place the labelScale axis and format tick labels
underThresholdGroup.append("g")
.attr("class", "legend-text")
.attr("transform", "translate(" + gradientBarWidth + ",0)")
.call(d3.axisRight(labelScale).ticks(legendArrayUnderThreshold.length).tickSize(2))
.select(".domain")
.remove()
// Place site legend items to right of temperature gradient
const tempLegend = document.querySelector('#temp-legend')
const siteLegendOffset = legendArray.includes(Math.round(tempThreshold)) ?
tempLegend.getBoundingClientRect().width + 12 :
tempLegend.getBoundingClientRect().width + 18
const legendGroupSites = svg.append("g")
.attr("id", "site-group")
.attr("transform", "translate(" + (siteLegendOffset) + "," + legendItemYOffset + ")")
const prioritySiteYOffset = siteMarkerOptions.radius + 20
const siteLegendTemp = 55
// append circle for forecast sites
legendGroupSites.append("circle")
.attr("class", "siteCircle")
.attr("cx", prioritySiteMarkerOptions.radius / 2)
.attr("cy", prioritySiteMarkerOptions.radius / 2)
.attr("r", siteMarkerOptions.radius)
.attr("fill", getTempColor(siteLegendTemp))
.attr("stroke", siteMarkerOptions.color)
.attr("stroke-width", siteMarkerOptions.weight)
// append two circles for priority sites
legendGroupSites.append("circle")
.attr("class", "siteCircle")
.attr("cx", prioritySiteMarkerOptions.radius / 2)
.attr("cy", prioritySiteMarkerOptions.radius / 2 + prioritySiteYOffset)
.attr("r", prioritySiteMarkerOptions.radius)
.attr("fill", prioritySiteMarkerOptions.fillColor)
.attr("stroke", prioritySiteMarkerOptions.color)
.attr("stroke-width", prioritySiteMarkerOptions.weight)
legendGroupSites.append("circle")
.attr("class", "siteCircle")
.attr("cx", prioritySiteMarkerOptions.radius / 2)
.attr("cy", prioritySiteMarkerOptions.radius / 2 + prioritySiteYOffset)
.attr("r", siteMarkerOptions.radius)
.attr("fill", getTempColor(siteLegendTemp))
.attr("stroke", siteMarkerOptions.color)
.attr("stroke-width", siteMarkerOptions.weight)
// add labels
const siteText = legendGroupSites.append("g")
.attr("class", "legend-text")
const siteTextXOffset = 20
const siteTextdY = "0.4em"
siteText.append("text")
.attr("x", siteTextXOffset)
.attr("y", siteMarkerOptions.radius / 2)
.attr("dy", siteTextdY)
.text("Forecast site")
siteText.append("text")
.attr("x", siteTextXOffset)
.attr("y", prioritySiteMarkerOptions.radius / 2 + prioritySiteYOffset)
.attr("dy", siteTextdY)
.text("Priority site")
}drbWshed = FileAttachment("data/drb_wshed.geojson").json()
forecastSegs = FileAttachment("data/forecast_segs_shape.geojson").json()
forecastPoints = FileAttachment("data/forecast_seg_endpoints.geojson").json()
drbStreams = FileAttachment("data/drb_streams.geojson").json()# add all images with markdown so that relative paths work in
# Leaflet pop-ups, but set include to false so that images aren't
# loaded on site render
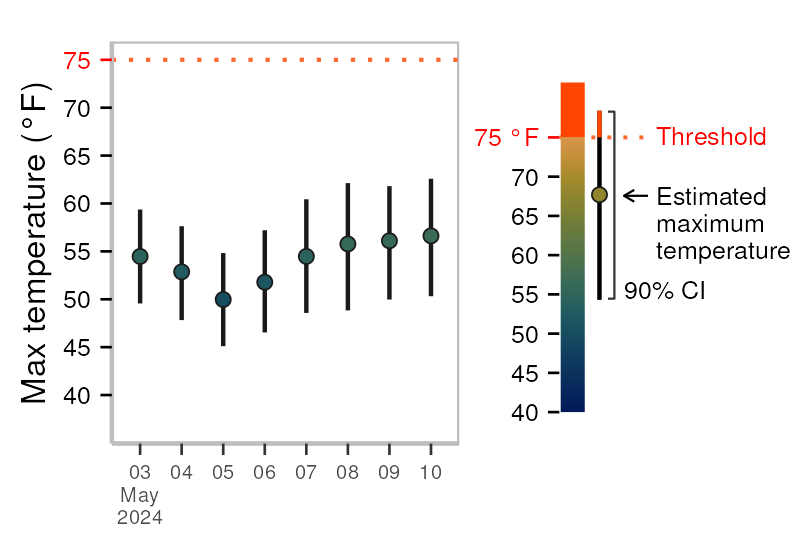
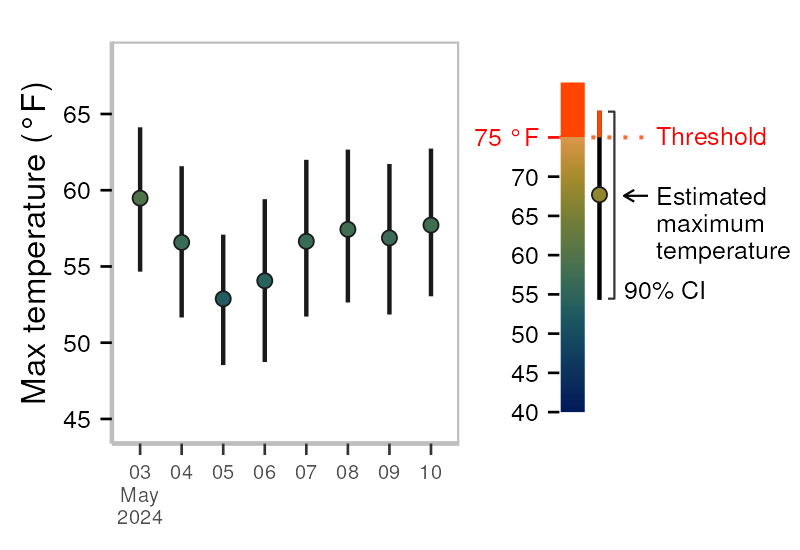
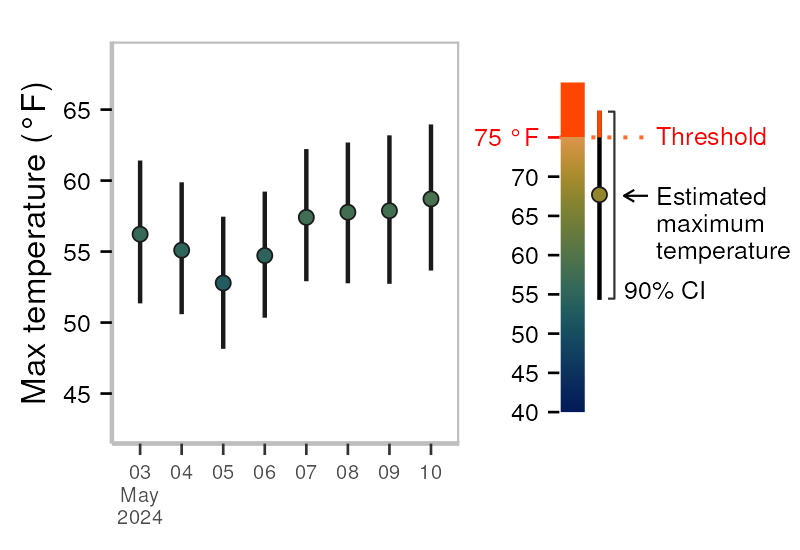
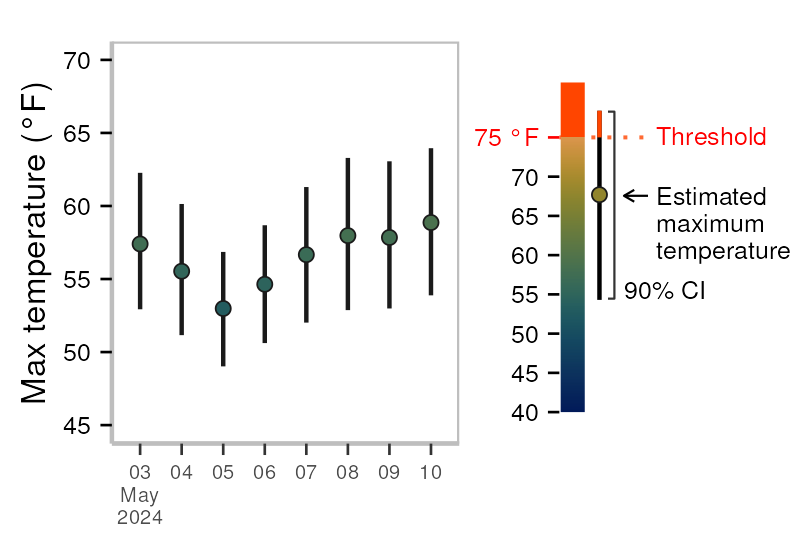
targets::tar_load(daily_interval_all_pngs)
knitr::include_graphics(daily_interval_all_pngs)


tempVar = 'mean_pred_max_temp_f'
transposedForecastData = transpose(forecastData)
forecastDates = [... new Set(transposedForecastData.map(d => d.time))]
issueDate = forecastDates[0]
currentDate = forecastDates[forecastDay]
parseDate = d3.timeParse("%Y-%m-%d")
formatDate = d3.timeFormat("%B %-d, %Y")
formattedIssueDate = formatDate(parseDate(issueDate))
formattedCurrentDate = formatDate(parseDate(currentDate))
formatWeekday = d3.timeFormat("%A")
formattedCurrentWeekday = formatWeekday(parseDate(currentDate))
filteredForecastData = transposedForecastData.filter(function(site_forecast) {
  return site_forecast.time == currentDate
})This information is preliminary or provisional and is subject to revision. It is being provided to meet the need for timely best science. The information has not received final approval by the U.S. Geological Survey (USGS) and is provided on the condition that neither the USGS nor the U.S. Government shall be held liable for any damages resulting from the authorized or unauthorized use of the information. These forecasts are being delivered on an experimental basis and will be discontinued on September 30, 2023. For more information on how these forecasts are generated, see the article by Zwart et al. 2023a and Zwart et al. 2023b.